COVID-19 And The SIR Model
Exploring the COVID-19 pandemic using a simulation based on the SIR model

Stefanie Schröck
Saturday, April 4, 2020
An exploration of the COVID-19 pandemic using a simulation based on the SIR model
COVID-19 is affecting all of us and while most have now accepted we need some kind of social distancing to stop the spread of the virus, one big question remains: how long is this going to take?
The pandemic has sent the world into turmoil and we are moving into uncharted waters… effectively, we have never experienced a pandemic of this scale AND economic implications … most likely this is also the first time we have captured so much data about a pandemic almost in realtime.
Whenever you need to make predictions about complex situations you have little prior experience with, models and simulations are a good starting point to explore the situations, test your assumptions, design strategies to deal with the situation and make qualitative and quantitative predictions about which effect the strategies might have.
This notebook contains a simulation of the COVID-19 pandemic … though is deliberately kept simple to ensure that users understand the underlying model and assumptions, it already is useful in allowing you to explore the implication of social distancing strategies. You can play with an interactive dashboard on www.covid-sim.com.
We have also provided the complete code for the simulation in the form of Javascript Codes, Jupyter notebooks and Python code on GitHub (in fact you can view this post as a Jupyter Notebook), so you can expand on the simulation if you would like to.

The underlying model is an implementation of the SIR model, which was developed in 1927 by Kermack and McKendrick to model the spreading of epidemics.

The SIR model is illustrated above using a System Dynamics stock and flow diagram – it is easy to understand, even if you have not encountered stock and flow diagrams before:
Essentially the population consists of those that are susceptible to becoming infected, those that are currently infectious and those that have recovered.
Susceptible people can become infected at a rate defined by the infection rate and infectious people recover at a rate defined by the recovery rate and die at a rate defined by the death rate.
People can only become infected through contact with infectious people, hence the infection rate depends on the number of infectious people, the contact rate (i.e. how many people a person meets every day) and on the infectivity, i.e. how likely it is that you will become infected if you meet an infectious person.
The recovery rate just depends on time, i.e. you either recover after a certain time.
The model illustrated here is roughly calibrated to the situation in Germany (as of 27.3.2020). It illustrates the effects of social distancing in achieving the objective of keeping the strain on the health care system as small as possible.
Key Assumptions:
- Contact Rate Defines how many people a person encounters per day on average, we assume this is about 20 people in the base case.
- Infectivity Defines the probability that a person becomes infected after contact with an infectious person. We assume this is at 2% in the base case.
- Duration Defines how long an infective person remains contagious. We assume the duration is 20 days in the base case.
- Population The susceptible population starts at 80 Mio., the infectious population starts at 120 persons.
- Intensive Care Needed Measures the number of infected people who need intensive care, set to 2% in the base case.
- Intensive Care Available The number of intensive care units available, set to 30.000 in the base case.
With the above settings, this means we have a contact number of 8 in the base settings. The contact number is the product of contact rate, infectivity and duration.
System Dynamics Model
Now let us take a look at the model in more detail. The SIR model discussed here is implemented in System Dynamics using the open-source BPTK-Py framework and Jupyter notebooks.
The best practice is to define all the model variables first and then to define the model equations using these variables.
Model Variables
Next, we define all the model variables. We will set their actual values and their equations in the equation section.
Stocks
The model only has four stocks, as explained above:
susceptible = model.stock("susceptible")infectious = model.stock("infectious")recovered = model.stock("recovered")deceased = model.stock("deceased")
Flows
Here are the flows discussed above:
infection_rate = model.flow("infection_rate")recovery_rate = model.flow("recovery_rate")death_rate = model.flow("death_rate")
Constants
The key parameters of the SIR model:
infectivity = model.constant("infectivity")lethality = model.constant("lethality")normal_contact_rate=model.constant("normal_contact_rate")duration = model.constant("duration")
The following parameters are used to model the strain on the health care system and in particular the intensive care units:
intensive_available = model.constant("intensive_available")intensive_percentage = model.constant("intensive_percentage")
Converters
The model does not need many converters, the only ones that are essential to the model are the total population and the contact rate:
total_population = model.converter("total_population")contact_rate = model.converter("contact_rate")
To calculate the strain on the health care system we need to work out the number of intensive care units needed:
intensive_needed = model.converter("intensive_needed")
Converters needed to calculate the key indicators:
contact_number = model.converter("contact_number")reproduction_rate = model.converter("reproduction_rate")
Model Equations
The key part of any System Dynamics model are the equations, let us take some time to investigate these:
We start with an initial value of 80 Mio. people for the `susceptible` stock (i.e. roughly the German population) and assume we have 120 infected people.
The settings for infectivity, lethality and contact rate are the key settings that determine how quickly the epidemic spreads within the population.susceptible.initial_value = 80000000.0infectious.initial_value = 120.0recovered.initial_value = 0.0deceased.initial_value = 0.0
We had to make some educated guesses here, as the true infectivity and lethality are currently not known:
Given the growth rate we saw in Germany with a doubling every two days and assuming that each person has 20 contacts per day on average (under normal circumstances, i.e. without social distancing), this resulted in the assumption of infectivity of 0.02
We assume it takes 20 days to recover from the virus and that the lethality is 0.001
infectivity.equation = 0.02duration.equation = 20.0lethality.equation = 0.001
In Germany, there are around 30,000 intensive care units and current data shows that ca. 0.2% of the infected need intensive care. The intensive care units needed are simply the infectious multiplied by that percentage.
The equations for the stock are easy to define:intensive_percentage.equation = 0.002intensive_available.equation = 30000.0intensive_needed.equation =infectious*intensive_percentage
- The susceptible population has an outflow defined by the infection rate.
- The infectious population increases through the infection rate and is depleted by the recovery rate and death rate.
- The recovered increase by the recovery rate. The model assumes that reinfection does not happen.
- The deceased increase by the death rate.
susceptible.equation = -infection_rateinfectious.equation = infection_rate - recovery_rate - death_raterecovered.equation = recovery_ratedeceased.equation = death_rate
The total population decreases slowly according to the death rate. Note that the model only includes deaths for those that die of the coronavirus. It also does not consider births.
total_population.equation = susceptible+infectious+recovered
Here are the key equations of the SIR model – they define the underlying dynamics: the infection rate, recovery rate and death rate.
Essentially, the infection rate equals the number of infectious people multiplied by the contact rate. This defines how many people come into contact with the virus every day through infected people. But we need to take into account that not every one of these people becomes infected, so we multiply this number by the infectivity. We also need to consider that some people who come into contact with infected people may be infected themselves, hence we multiply by the fraction of susceptible people. This leads to the following equation for the infection rate:
infection_rate.equation = (contact_rate*infectivity*infectious)*(susceptible/total_population)
The recovery rate is equal to the number of infectious people divided by the duration: not all people recover at the same time, the number of infectious people declines exponentially.
The death rate is defined as the number of infectious people multiplied by lethality.recovery_rate.equation = infectious/duration
Here are the equations for two important indicators of any epidemic, the contact number and the reproduction rate: the contact number is an indicator of how many people an infected person could infect before he recovers, i.e. the product of contact rate, infectivity and duration. The reproduction rate is equal to the contact rate multiplied by the fraction of susceptible people.death_rate.equation = infectious*lethality
The equations above are almost all you need to simulate the SIR model, all that is missing is a value for the contact rate. In the basic SIR model, the contact rate is simply a constant value, and we assume that the average contact rate is 20 for the base settings. Let us quickly test this, to see whether the model is working:contact_number.equation=contact_rate*infectivity*durationreproduction_rate.equation=contact_number*(susceptible/total_population)
contact_rate.equation=20
Simulation Dashboard
The simulation dashboard below lets you experiment with different settings for the contact rate and more sophisticated social distancing scenarios. Play with it for a little before you read on about the different scenarios we have analyzed in more detail.
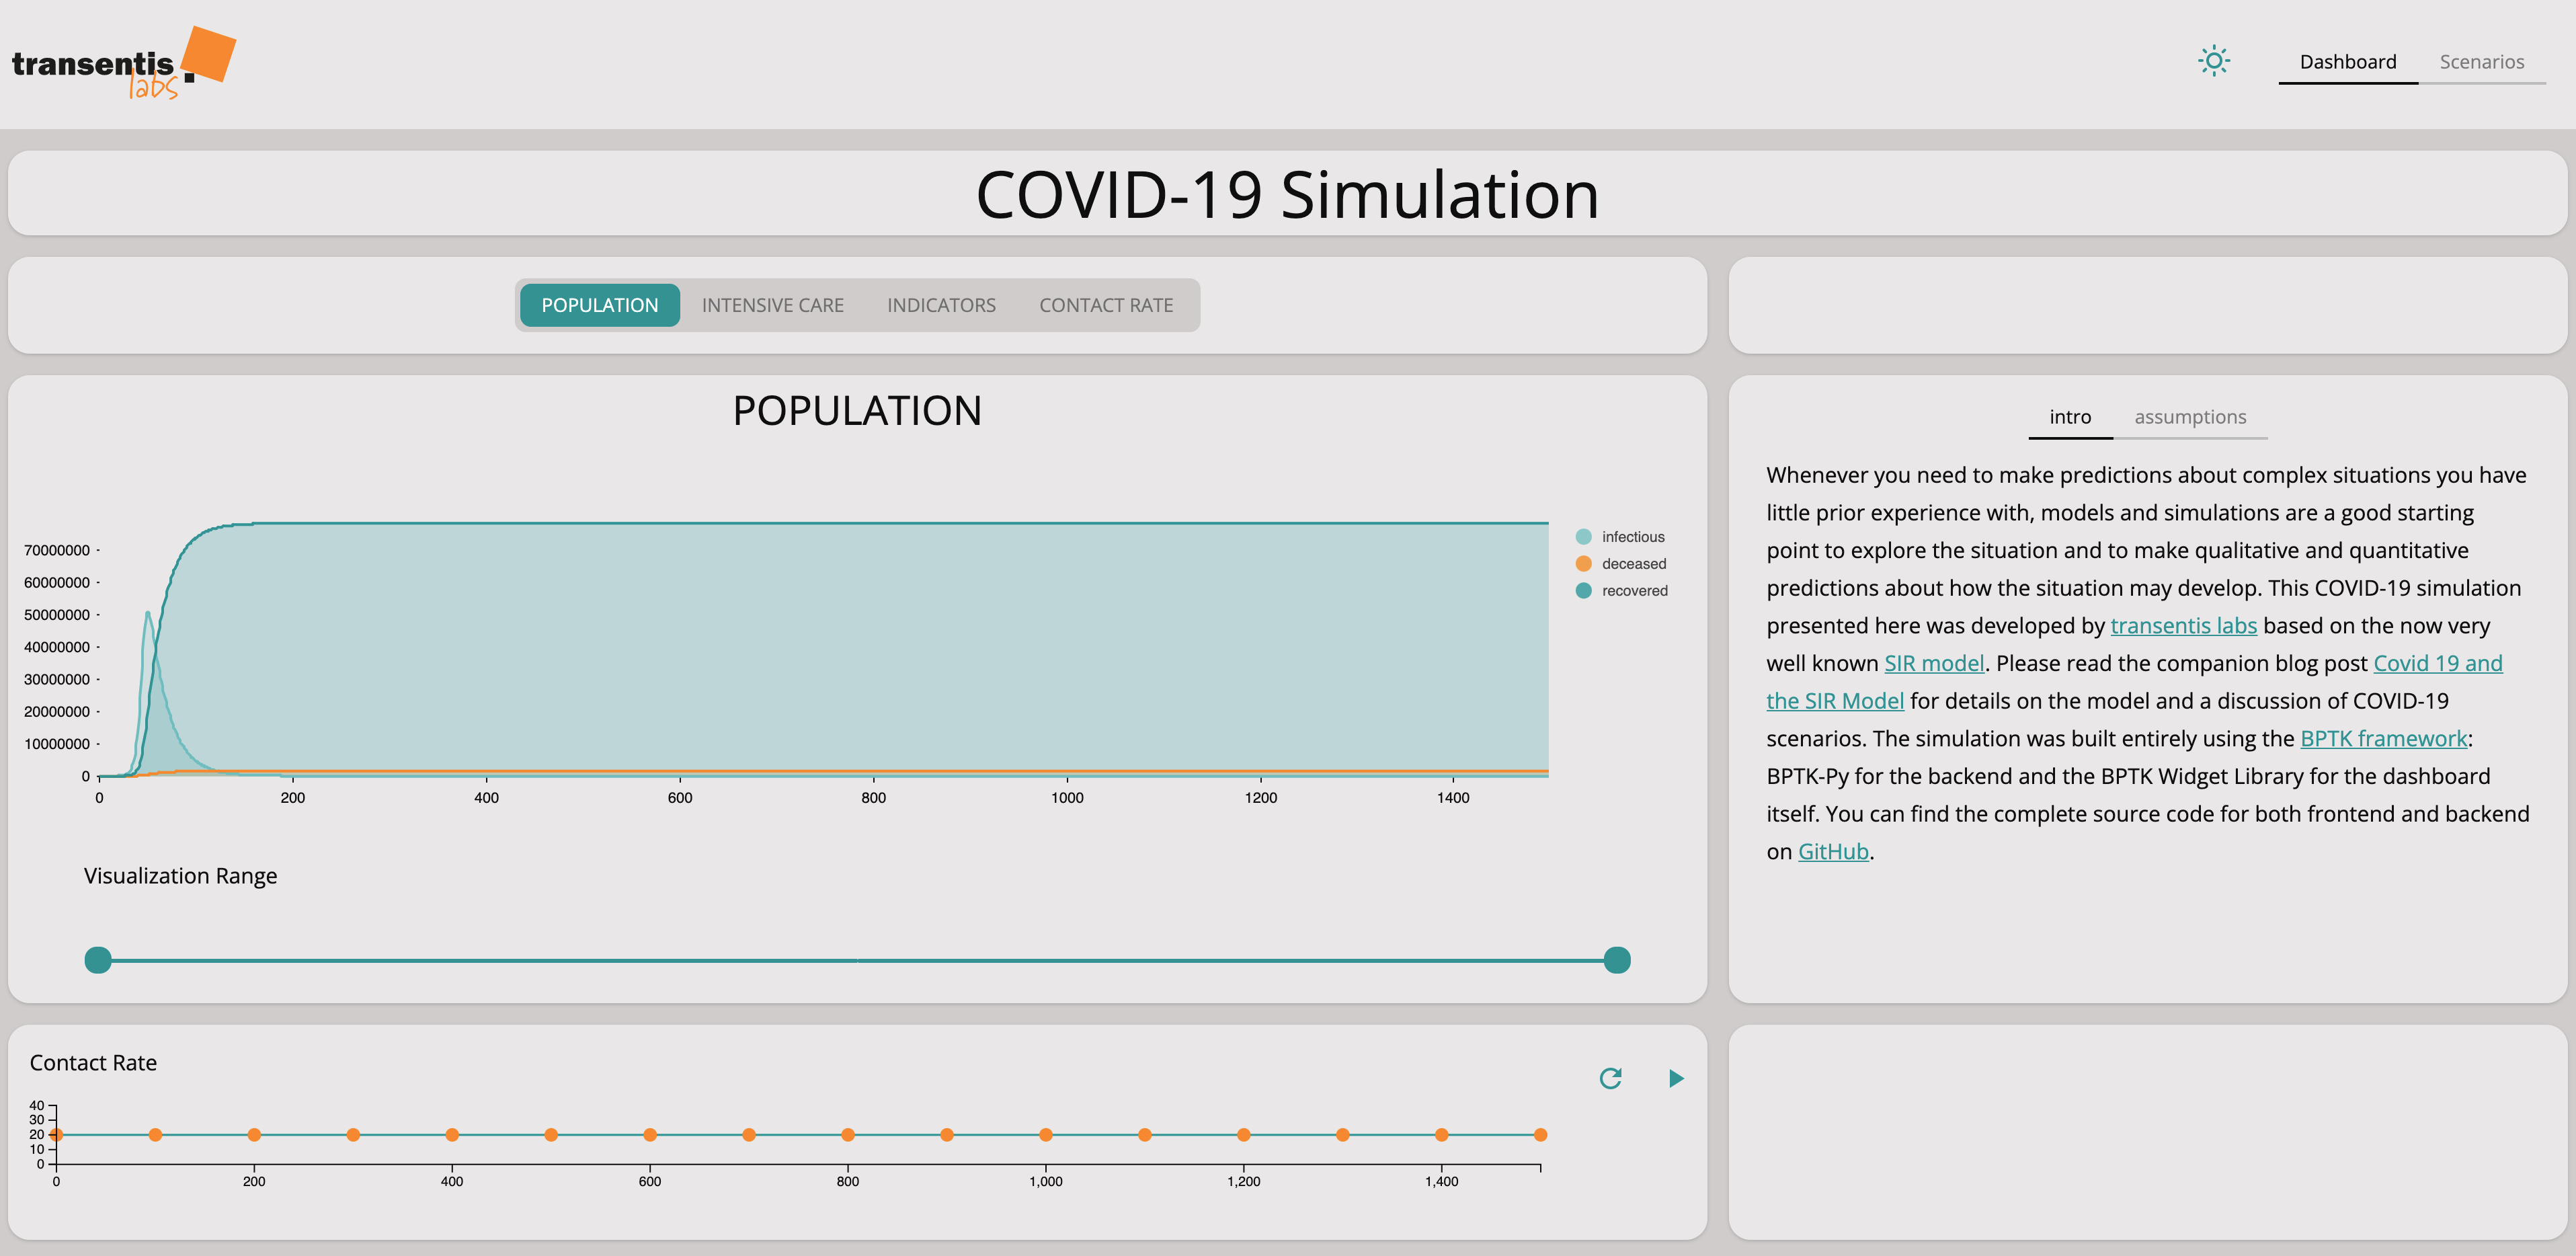
You can experiment with the dashboard directly at www.covid-sim.com. We have published the dashboard as an interactive Jupyter Notebook in our Github Repository. Please download and install it from there.
See if you can find a scenario that keeps the number of intensive care units needed below the number of units available.
See what difference it makes if you set the number of contacts to 0 during social distancing or if you keep them at a small number.
If you set the number of contacts to zero, then nobody will become infected and we just move the problem into the future. What needs to be done to avoid this is to keep the infection rate at a level that the health care system can tolerate but ensuring that the population slowly becomes immune to avoid moving the problem into the future.
This effect also shows a limitation in the SIR model … the recovery rate is modeled as an exponential decay, so the infectious stock never drops completely to zero.
Scenario Analysis
Now that we have a simulation with the necessary parameters, we can experiment with different scenarios to see what effect social distancing will have and how long it might take before we can get back to a normal situation.
So far we have investigated four scenarios:
Base Case. In this case, we do not change our social behavior and continue as before. The coronavirus spreads very quickly, leading to very high demand on the health care system.
Slow social distancing. In this case, we try to reduce the speed at which the virus spreads, by slowly introducing social distancing. The simulation shows that this hardly has any effect, i.e. the measures taken in Germany to introduce rapid social distancing were right.
Rapid social distancing, long-term. In this case, we introduce rapid social distancing measures and leave them in place for quite some time. The simulation shows that we manage to slow the spread of the virus sufficiently to keep the strain on the health care system low. But unfortunately, the measures also take quite some time.
Rapid social distancing, short-term. In this case, we introduce rapid social distancing measures but ease them very quickly. Unfortunately, the simulation shows that this does not work – we only manage to move the peak into the future. So unless we manage to come up with other measures such as a vaccine, this strategy will not help.
Base Case
The base case describes the numbers in Germany and demonstrates what will happen if no measures are taken.
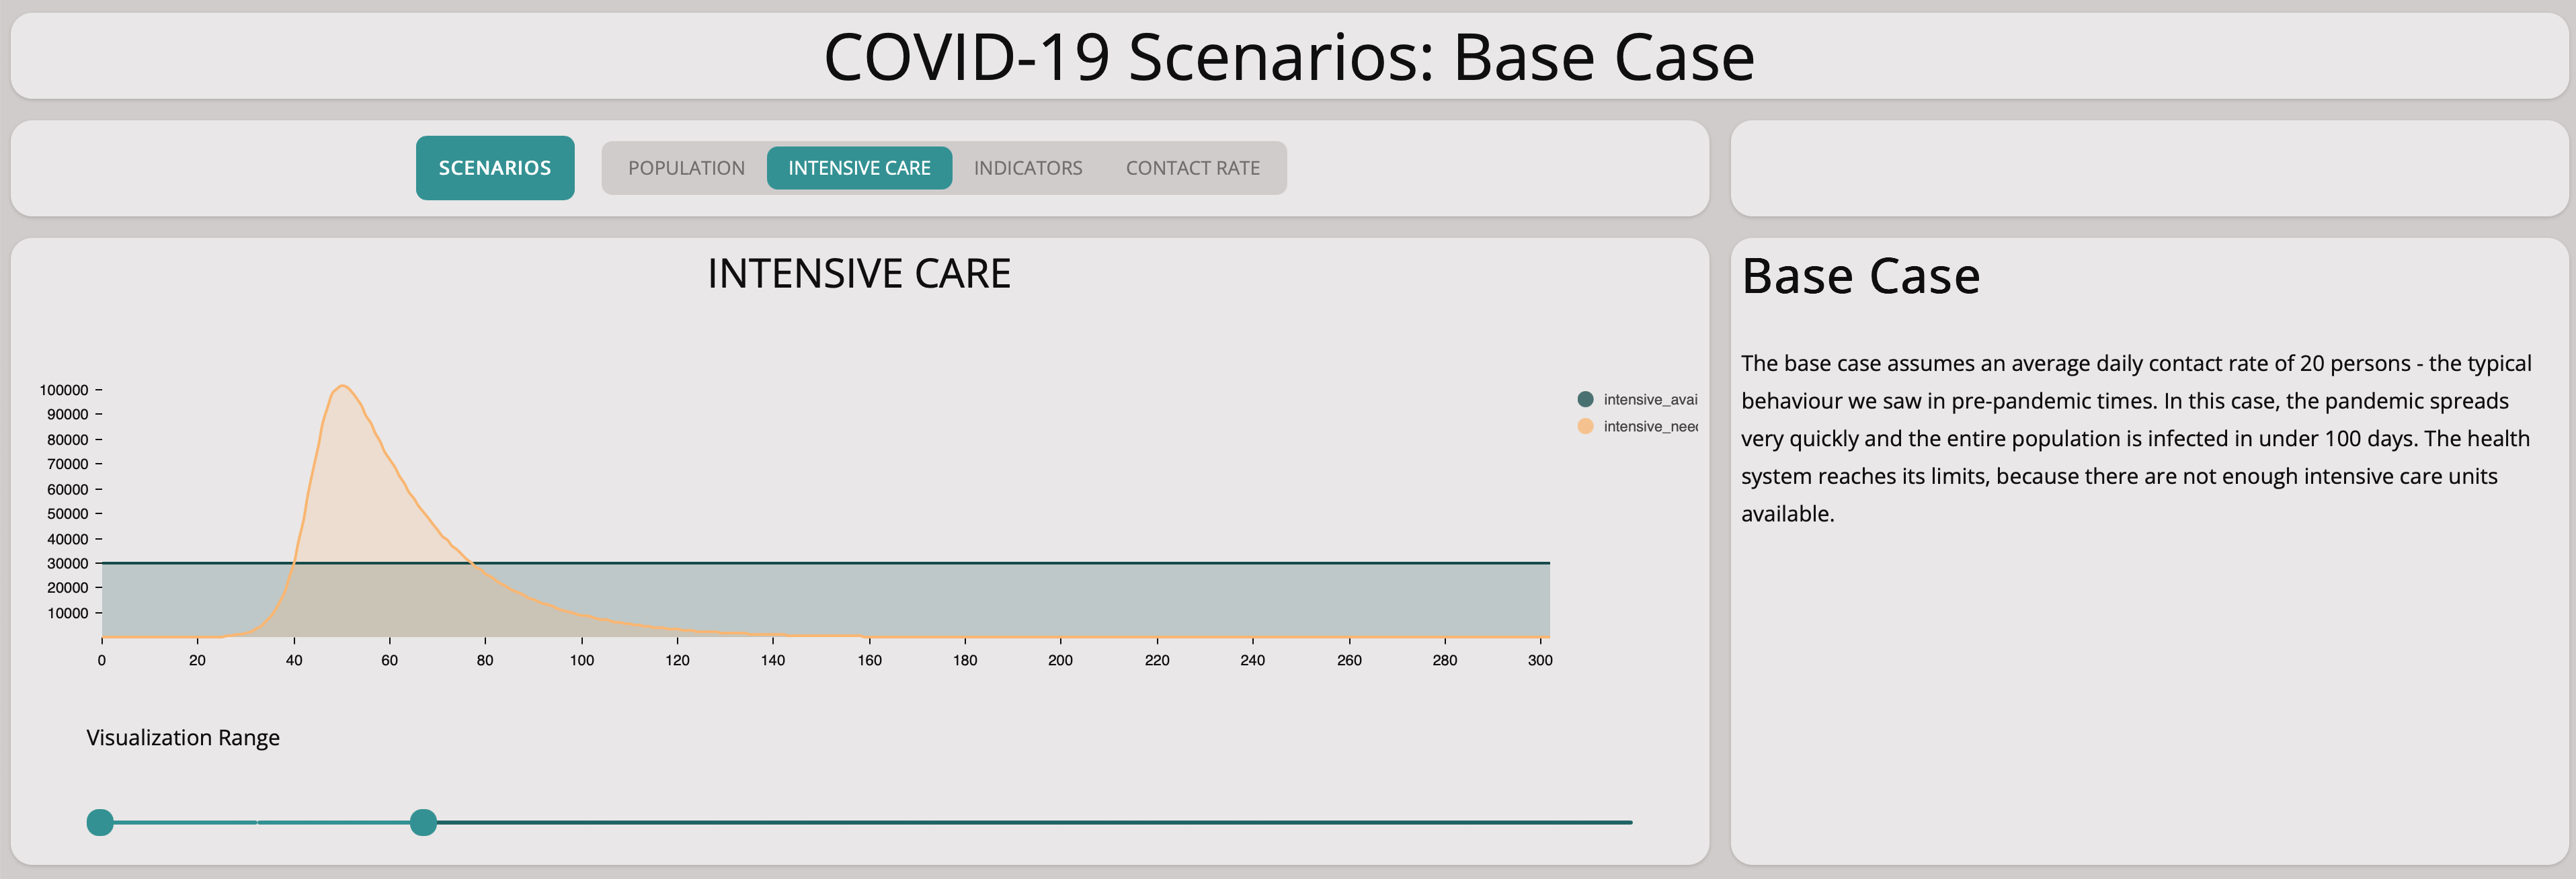
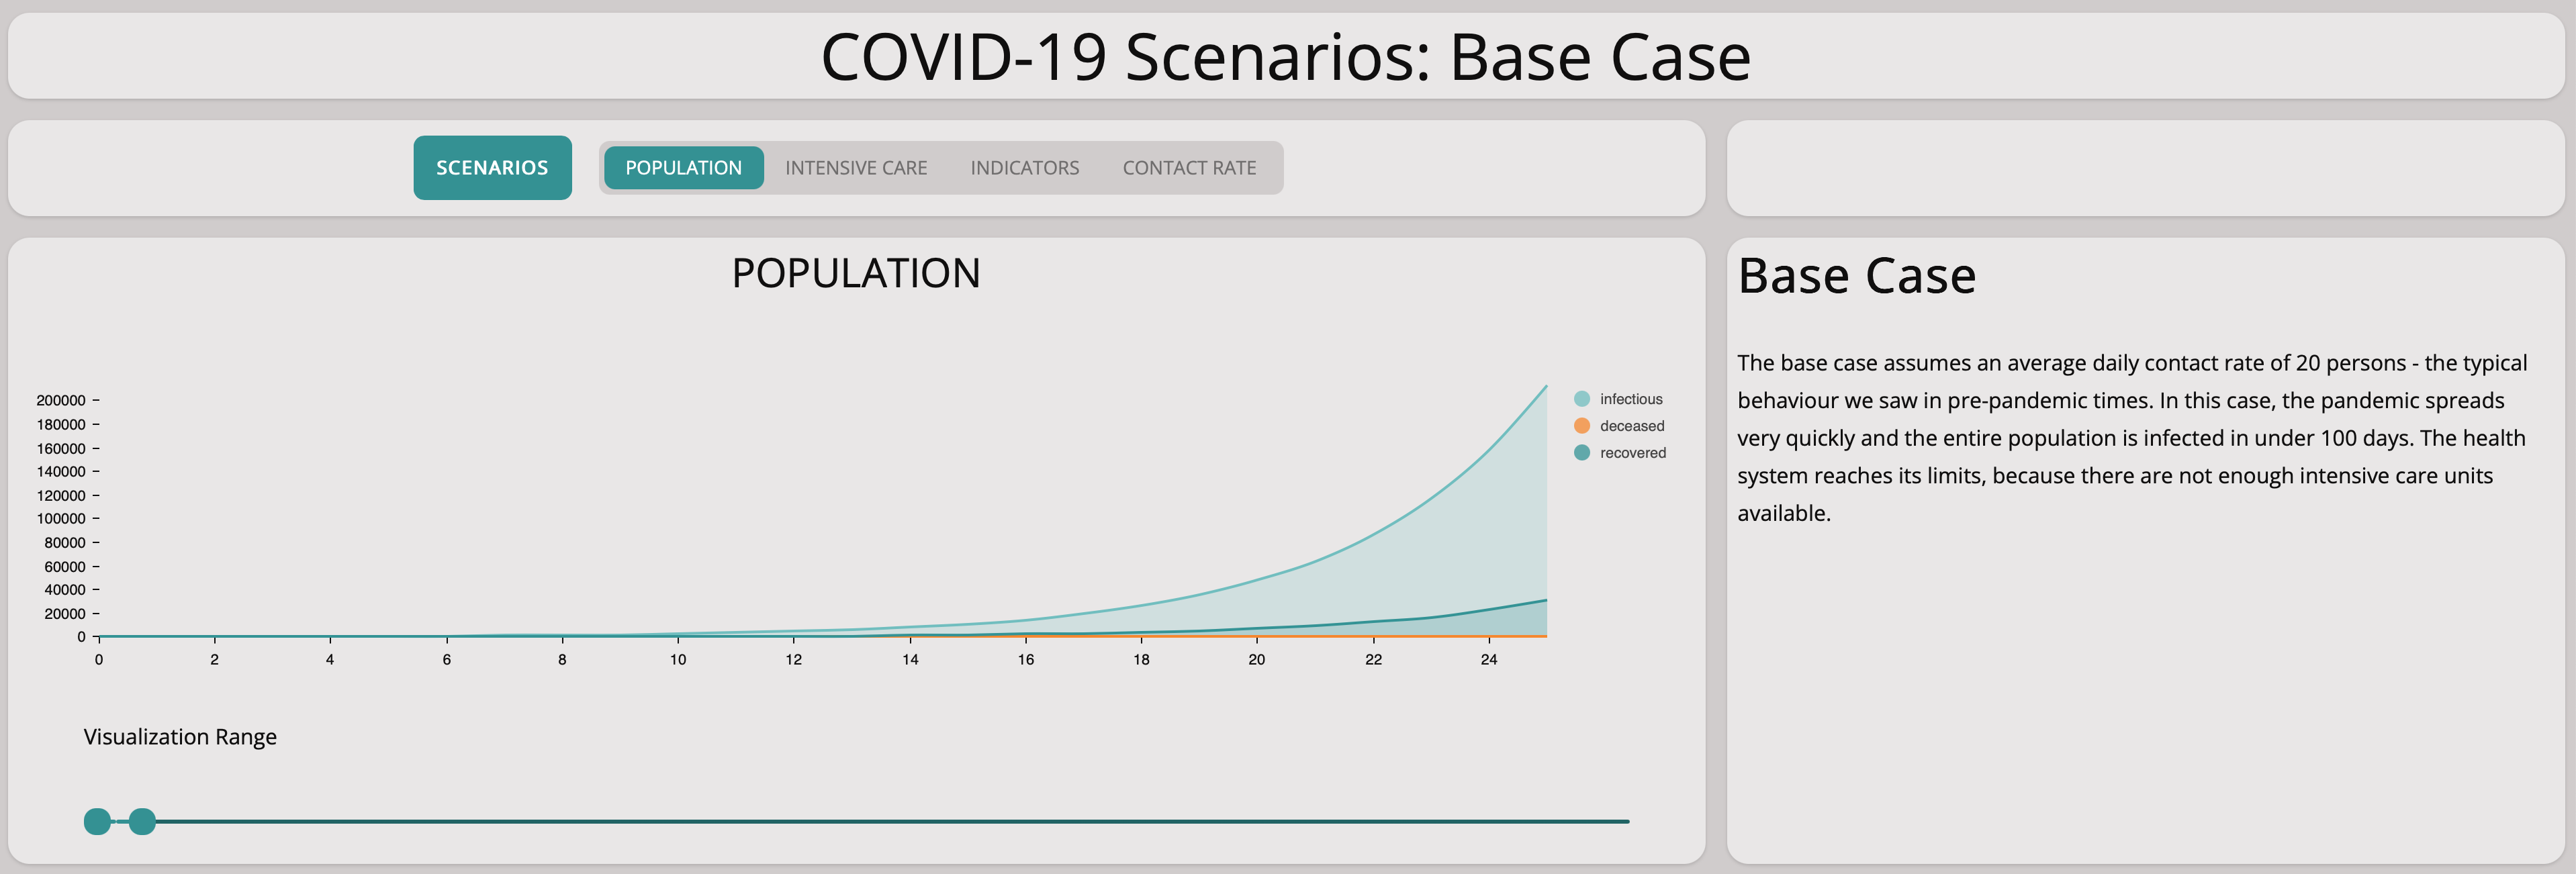
Without any measures, the numbers lead to explosive exponential growth as shown in the graph above. The graph below zooms in on the first 25 days – the exponential growth is already visible and the numbers match the situation in Germany well.
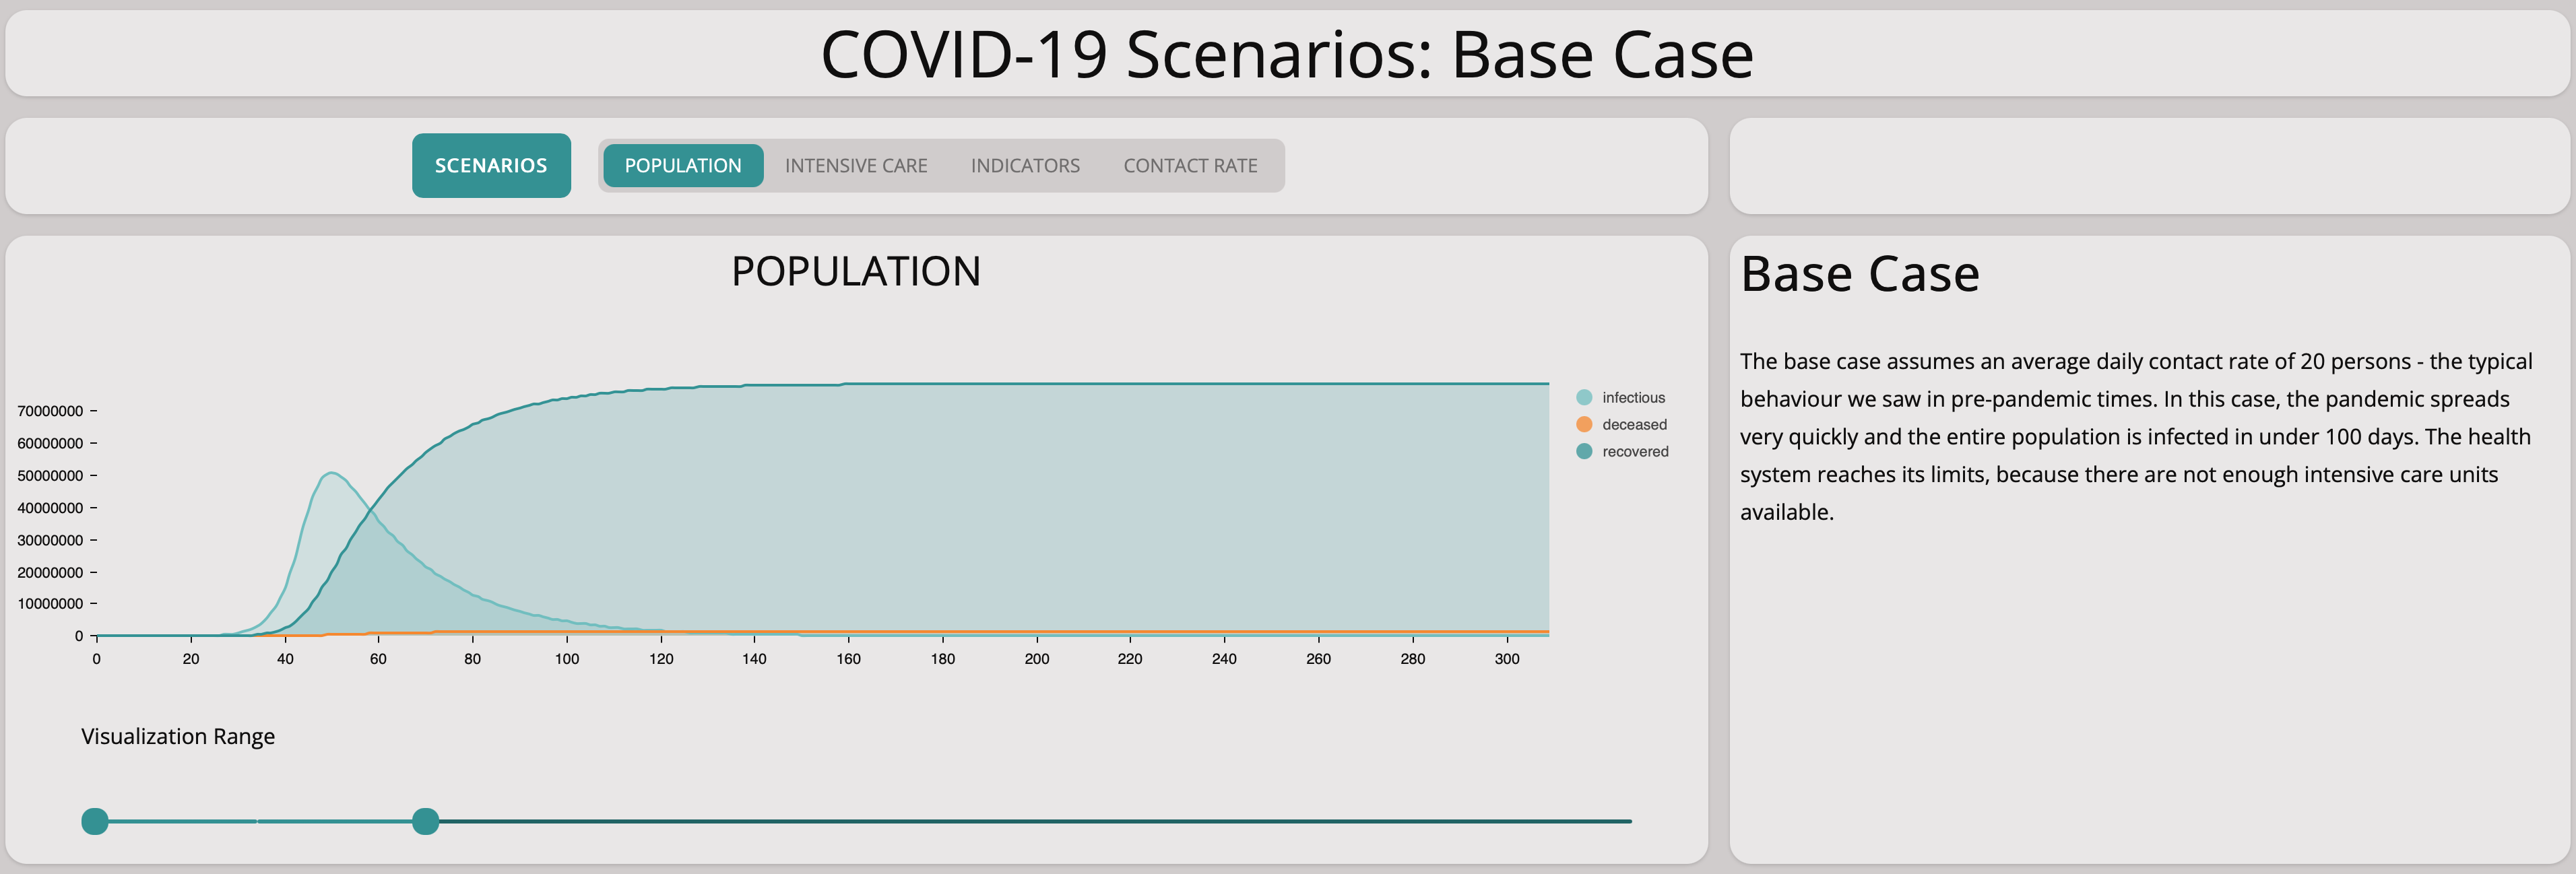
A closer look at the first 25 days shows the model matches the situation in Germany quite well.
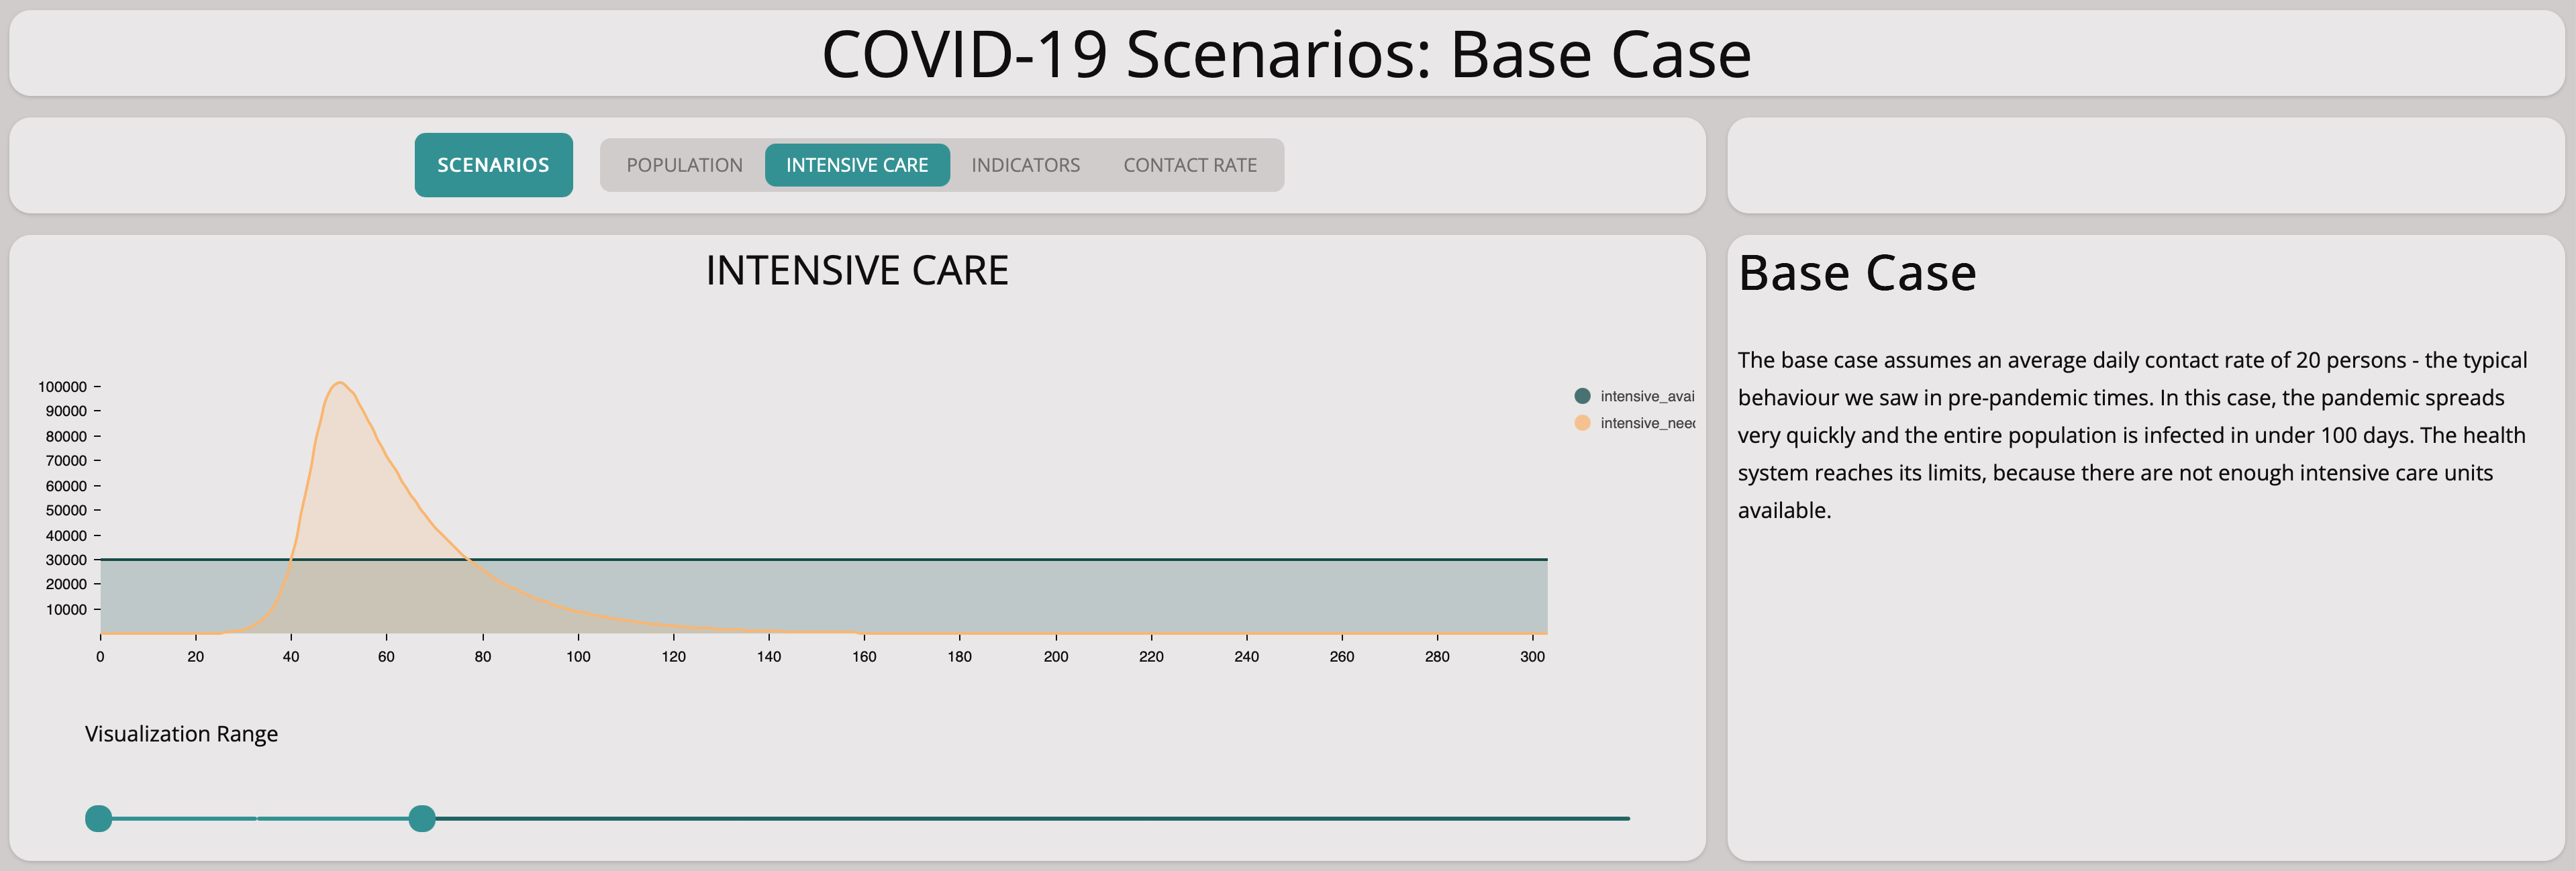
Unfortunately, this scenario illustrates well that there are not enough intensive care units available if the epidemic is left to grow without countermeasures.
Reducing Spreading of The Virus
How can we reduce the impact of the epidemic? The key parameters that influence the magnitude of the epidemic are the contact rate and the infectivity.
The only way to reduce the infectivity is to find a vaccine that immunizes the population – this is not a short-term option.
The remaining lever is the contact rate – we can reduce this through social distancing.
Weak Social Distancing
In this scenario, we investigate what happens if we reduce the contact rate but only by a little at a time in a very slow manner.
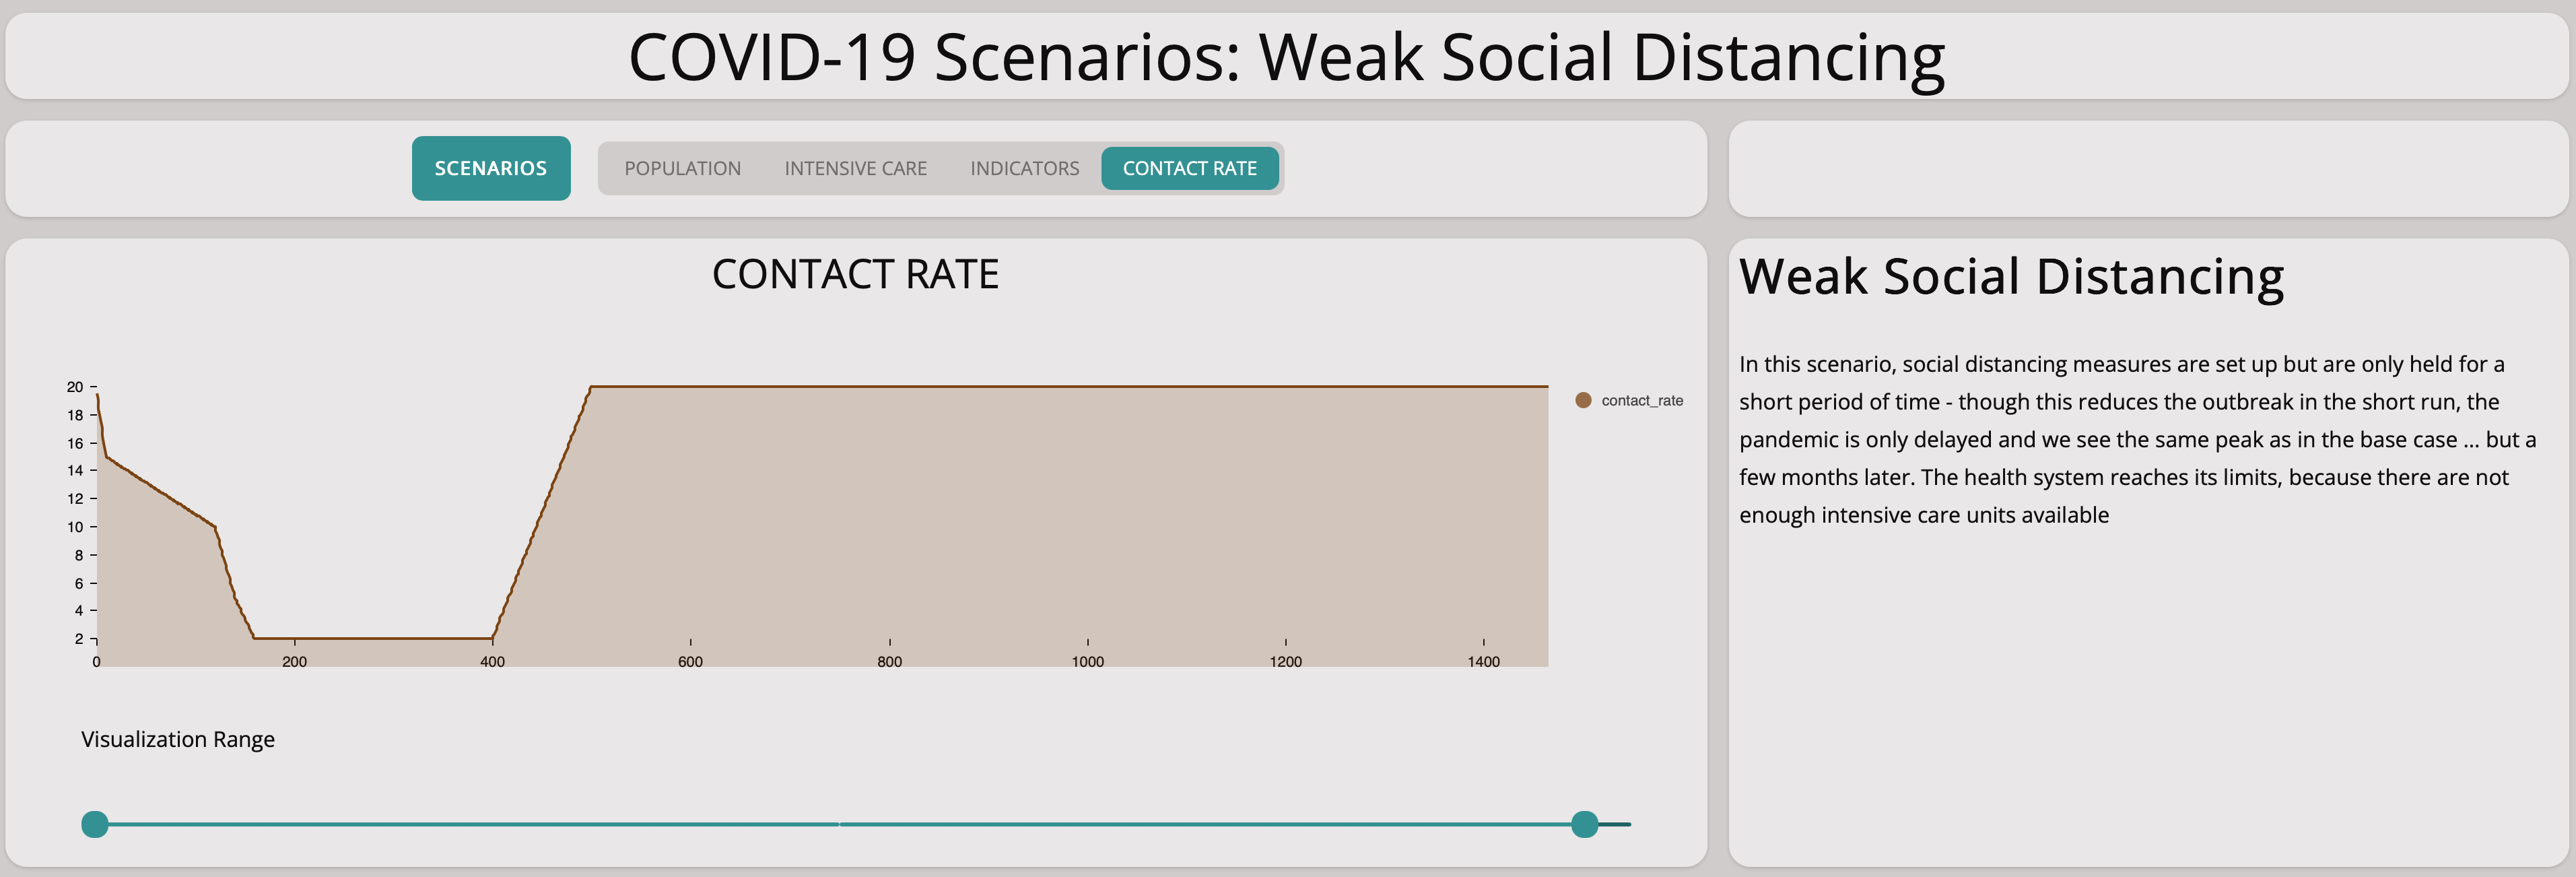
It is easy to see this will not help at all:
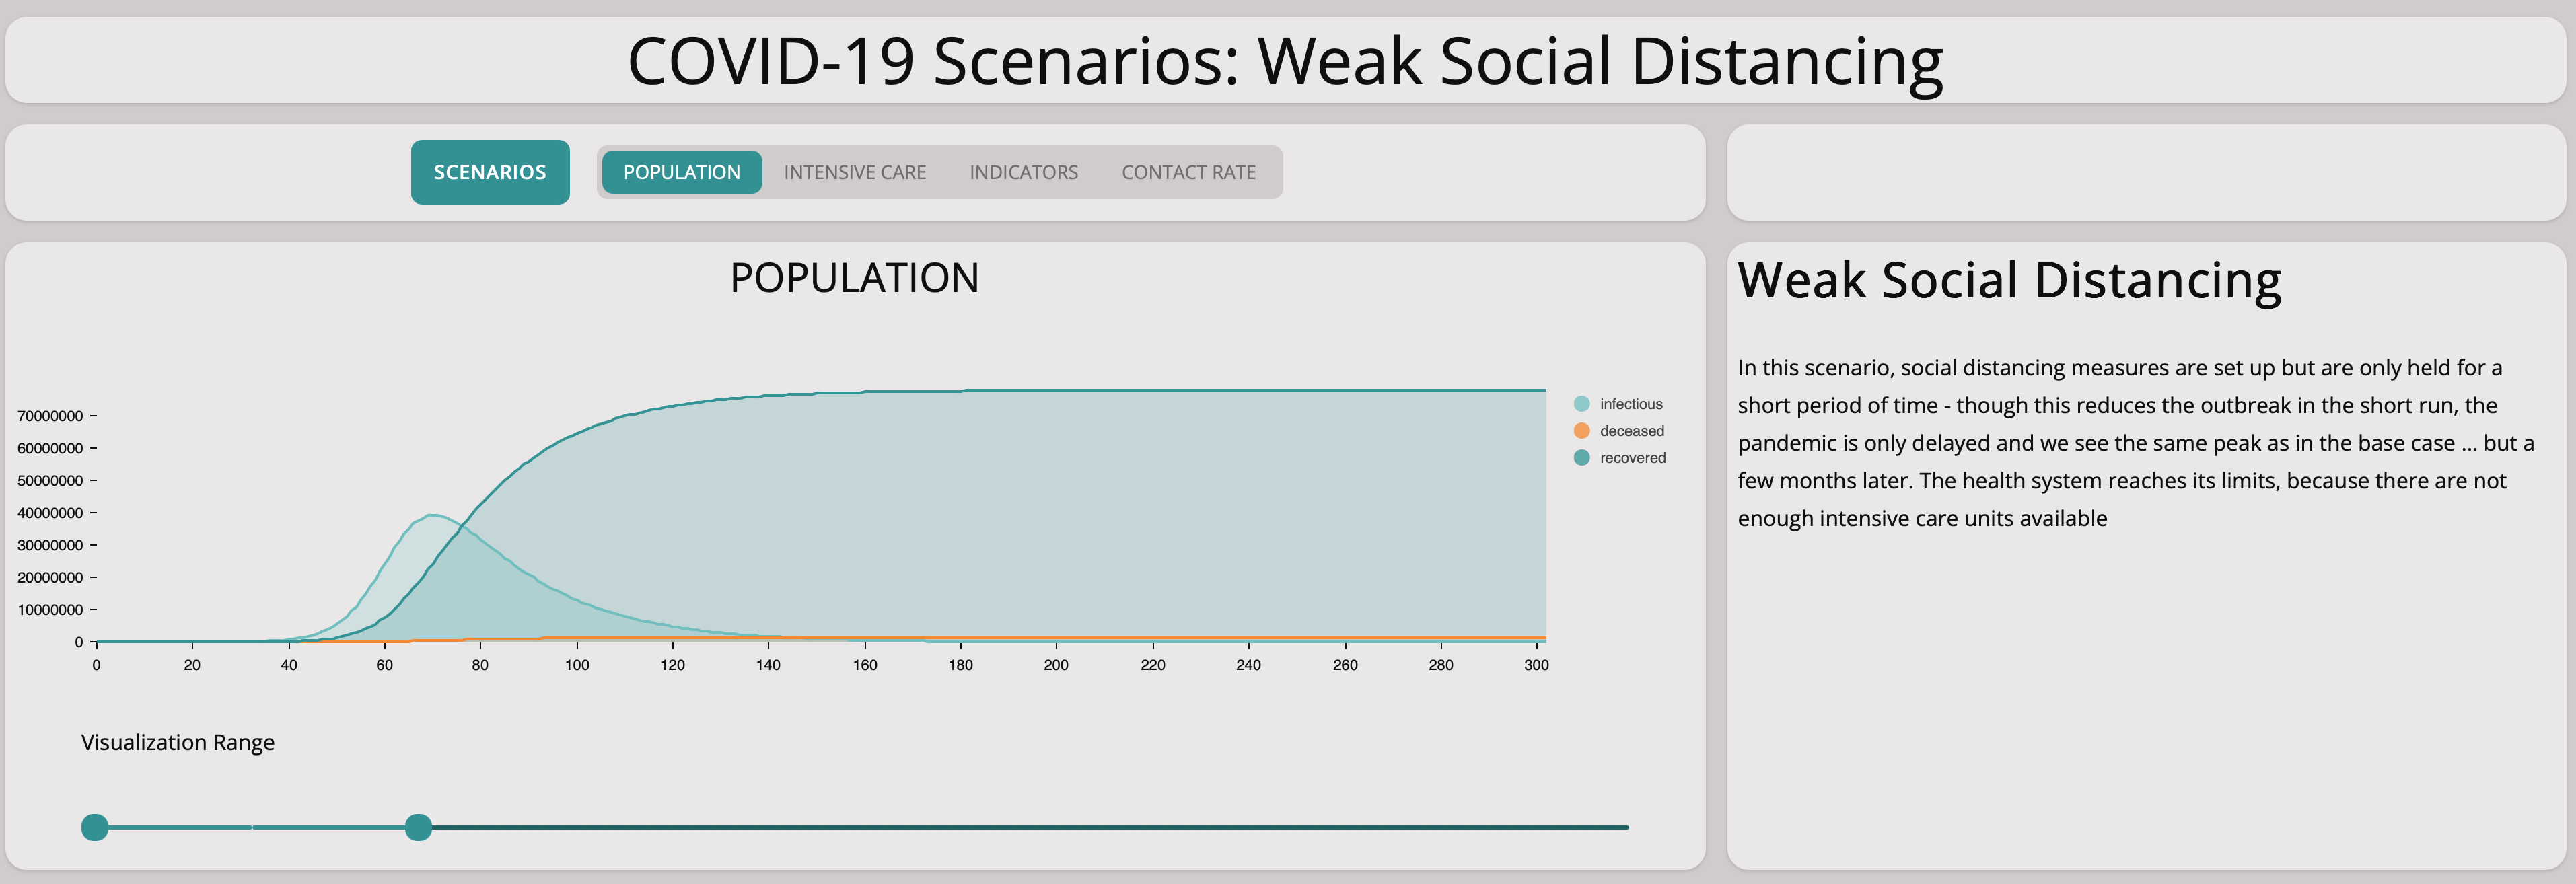
As you can see from the graph above, the number of infectious population is still growing exponentially. Comparing the base scenario with this slow measures scenario, we can see that there is no significant difference. Taking measures too cautiously does not stop the spreading of the virus.
Strong Social Distancing
Clearly, we need stronger measures. In this scenario, we investigate what happens if we introduce strong measures rapidly and keep them up for quite some time:
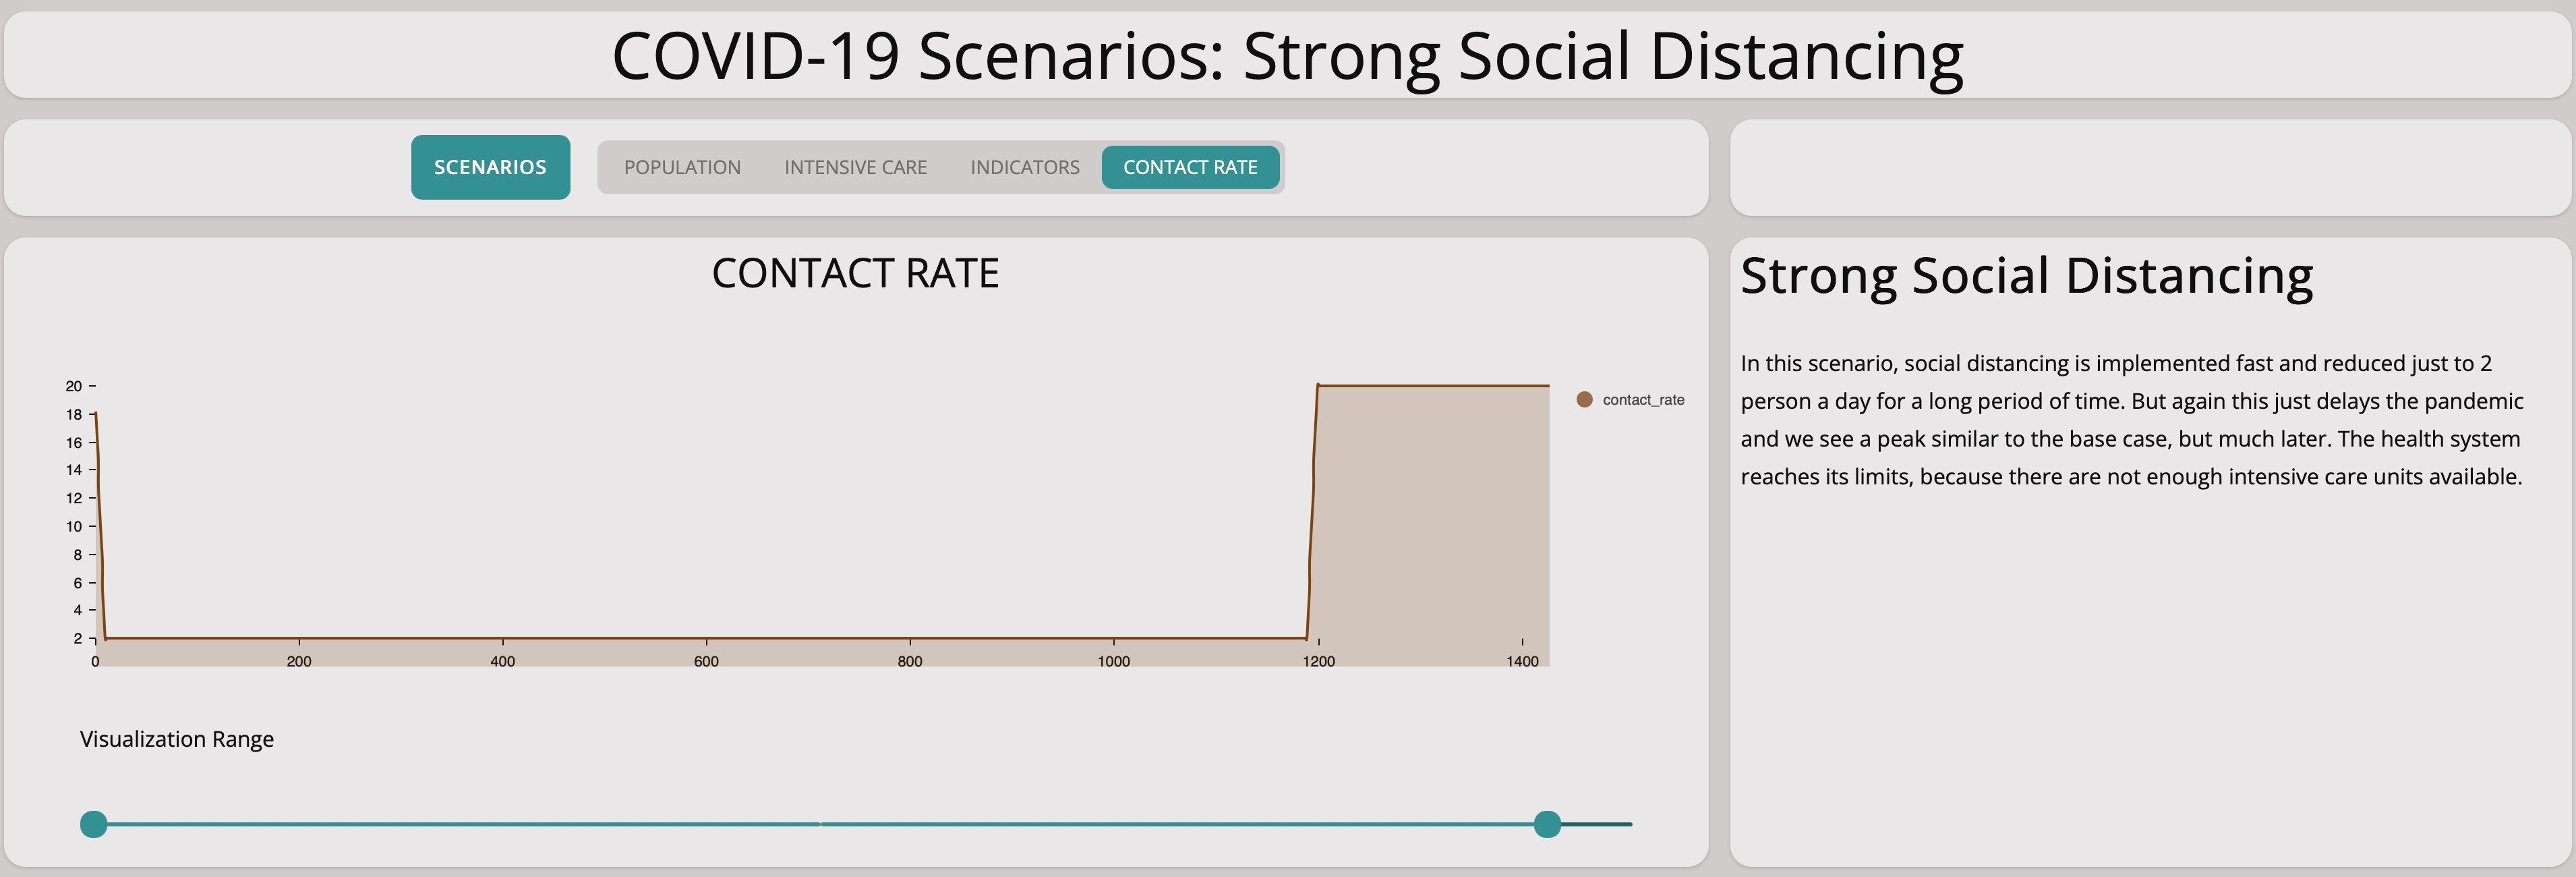
The graph below shows that strict measures help to reduce the spreading of the virus. The infectious population does not grow exponentially. This is good to know – we can achieve something by social distancing, the main remaining question is how harsh the measures have to be.
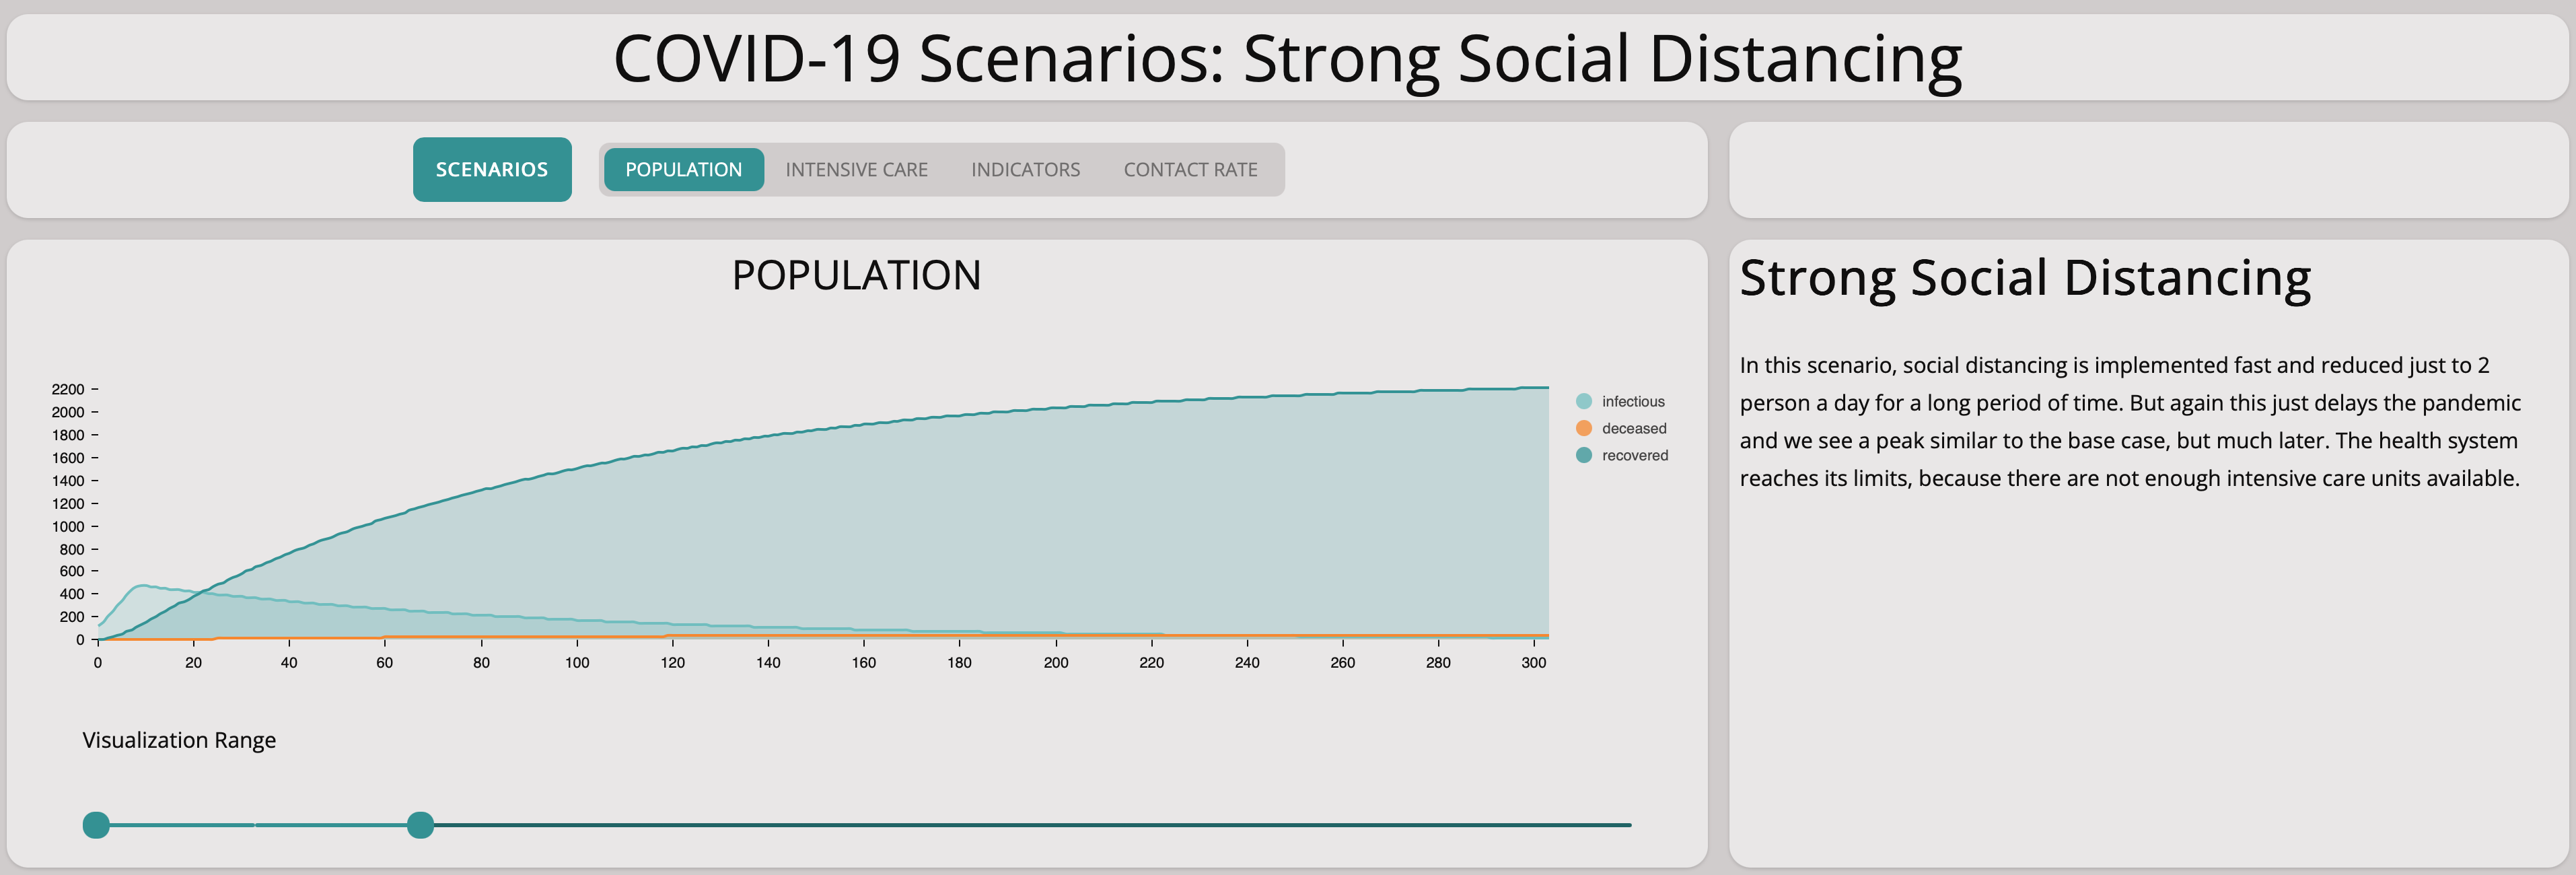
Comparing this scenario with the base scenario we can see how important social distancing is.
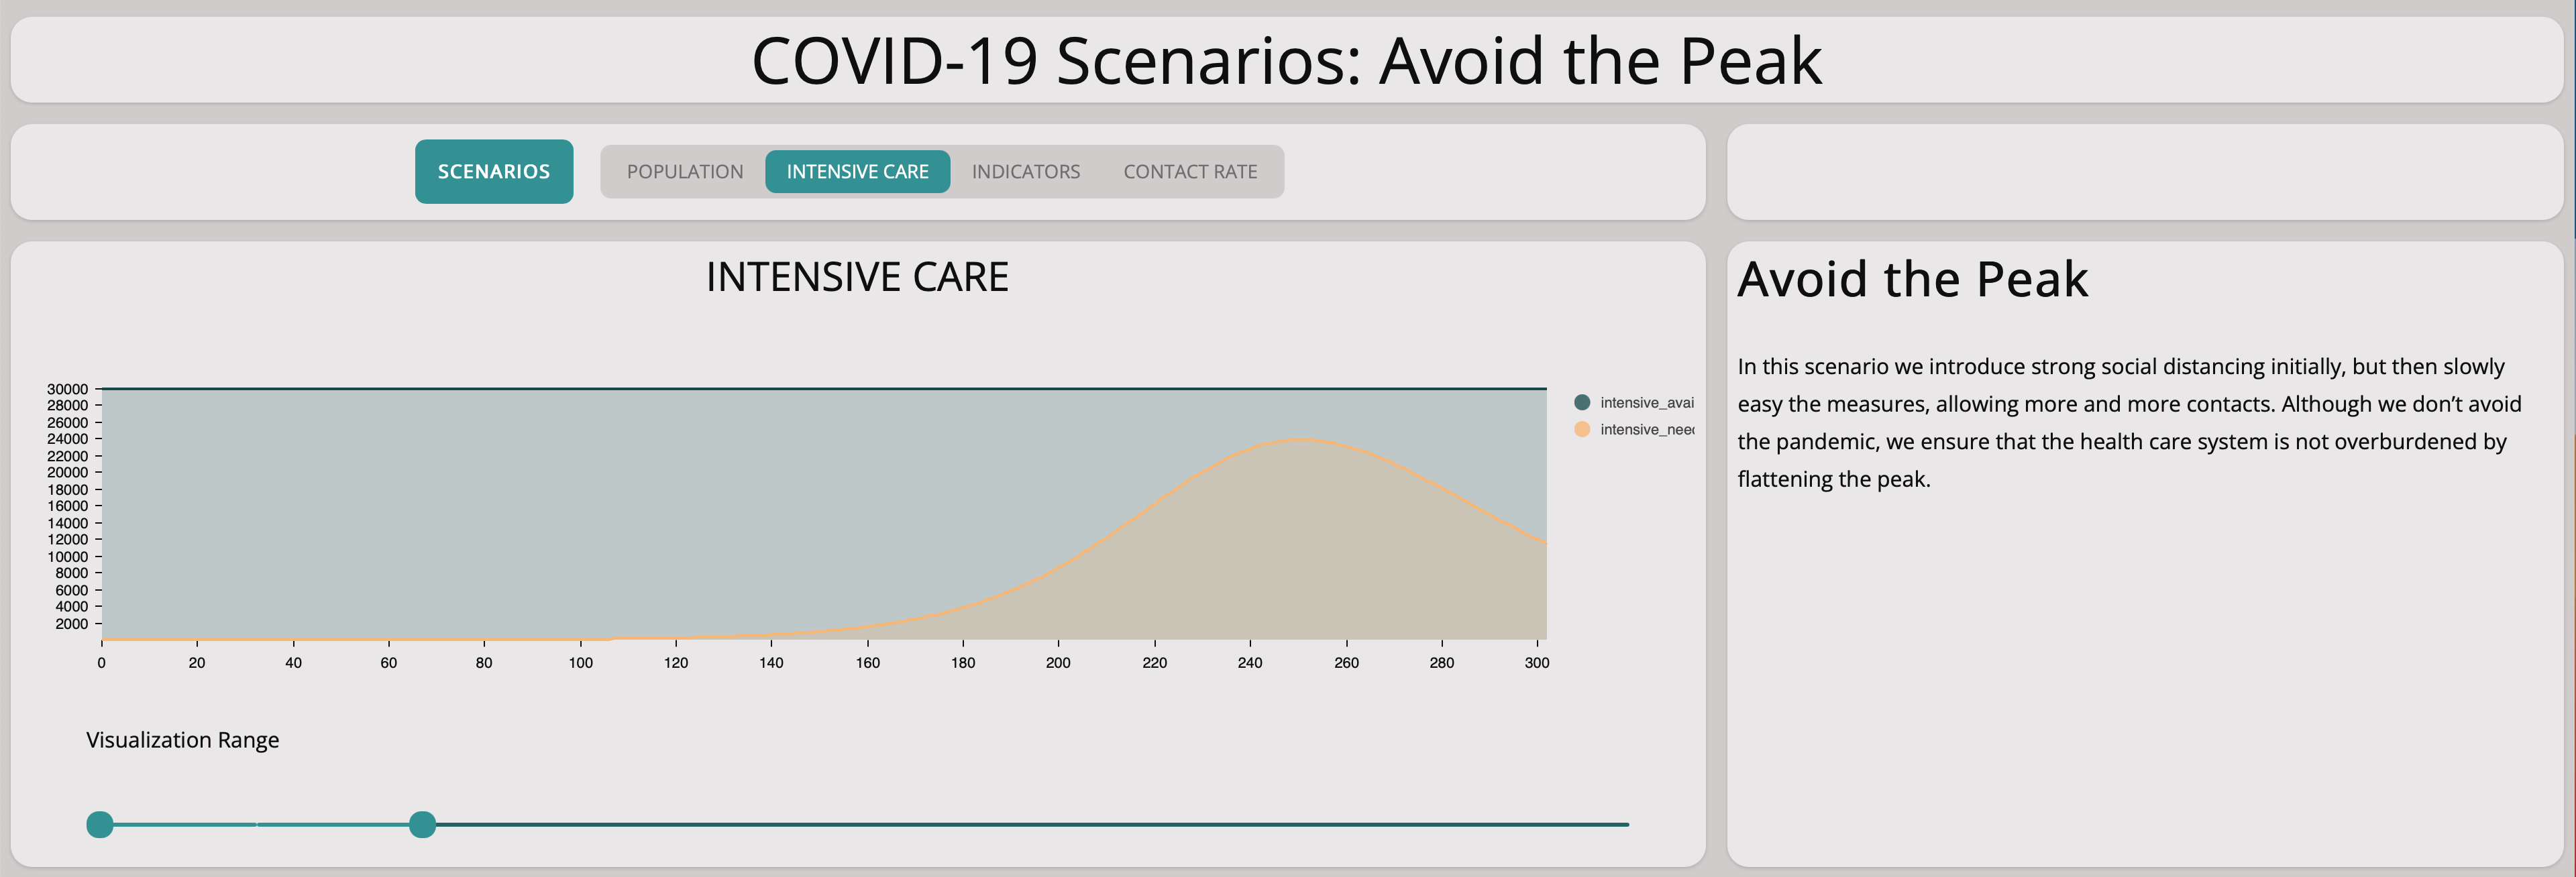
For this scenario, there are enough intensive care units available. A collapse of the health care system will not happen.
Reducing Contact Rate From Large Groups to Two People For Only a Short Period of Time
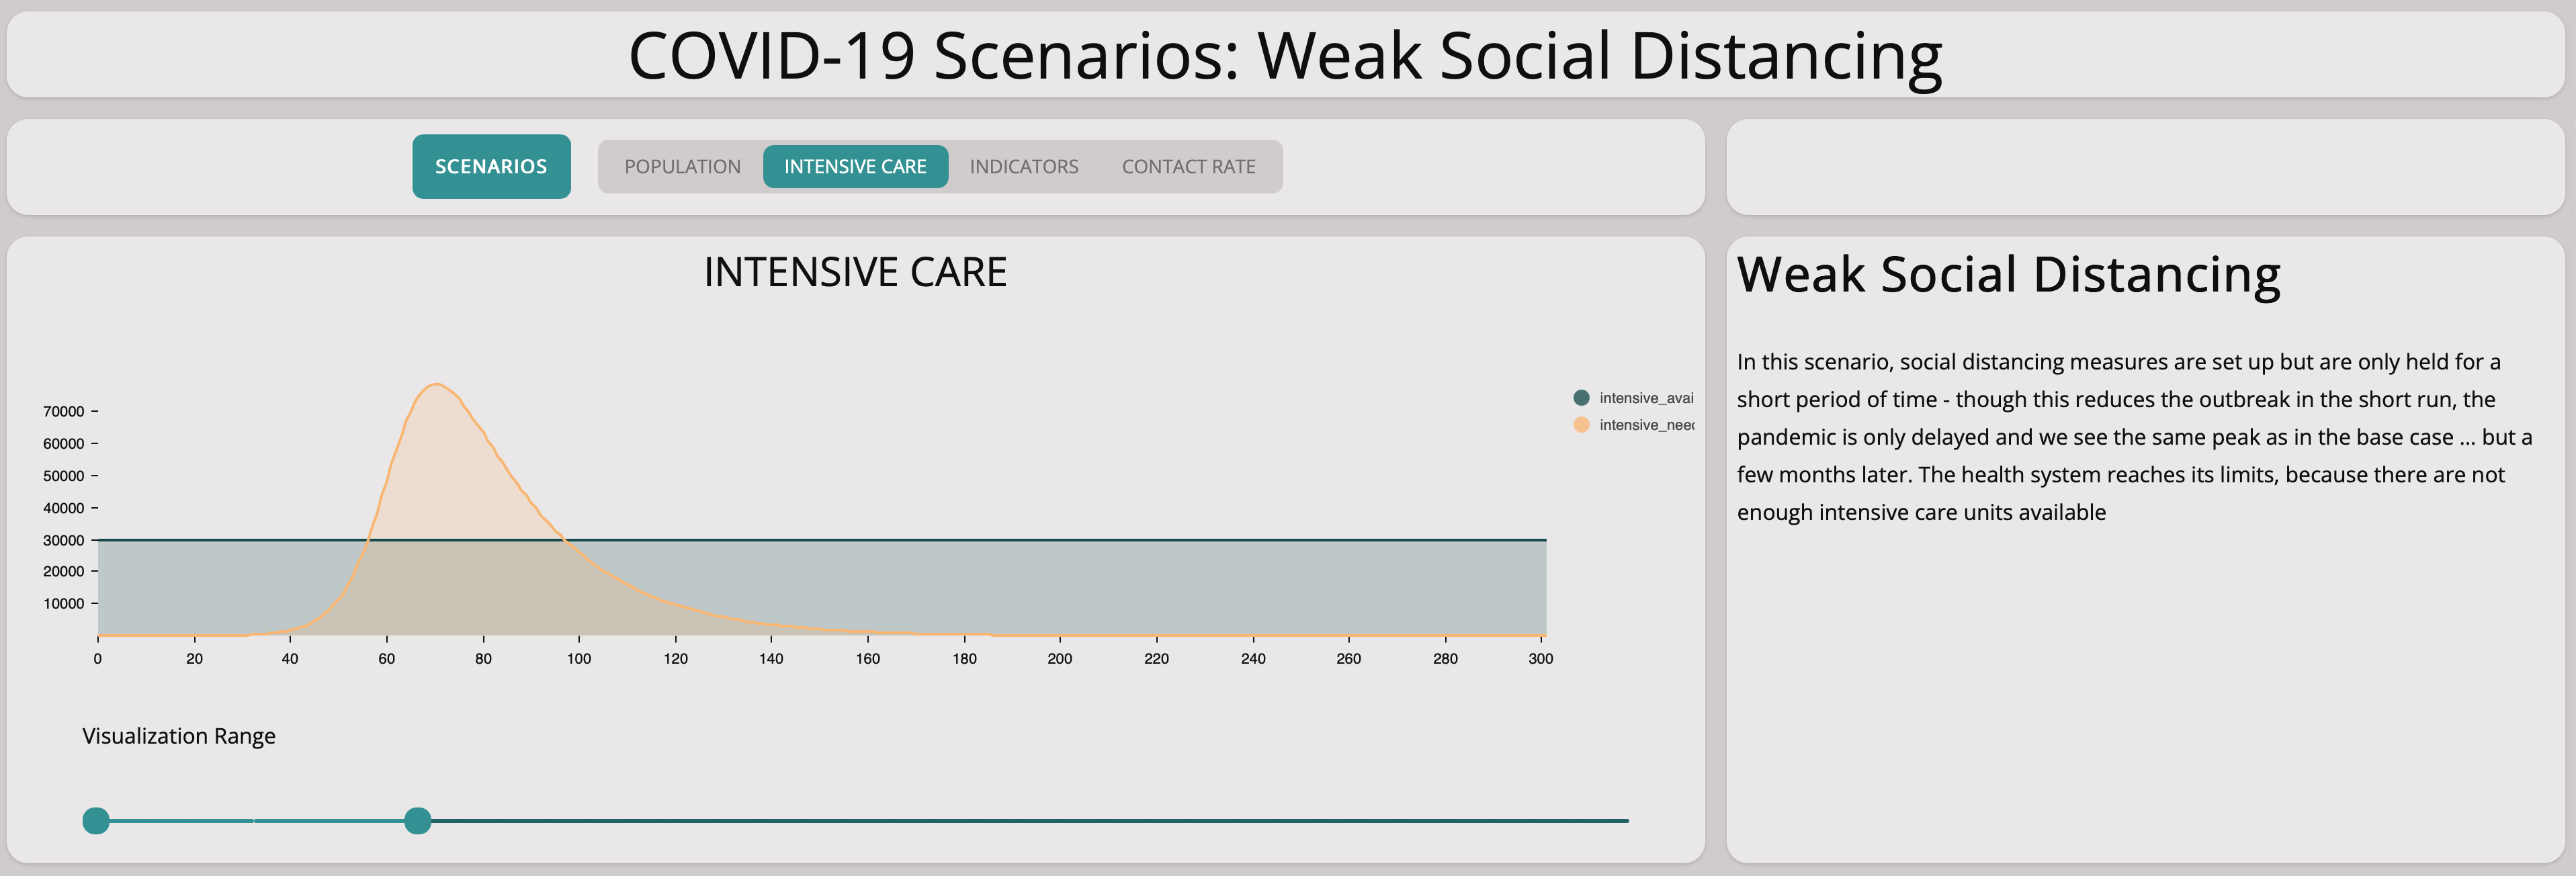
This scenario shows the effect of taking measures radically to avoid spreading the virus but then loosening them after only a short period of time. We reduce the contact rate to two after ten days and then increase it again to 20, 90 days later.
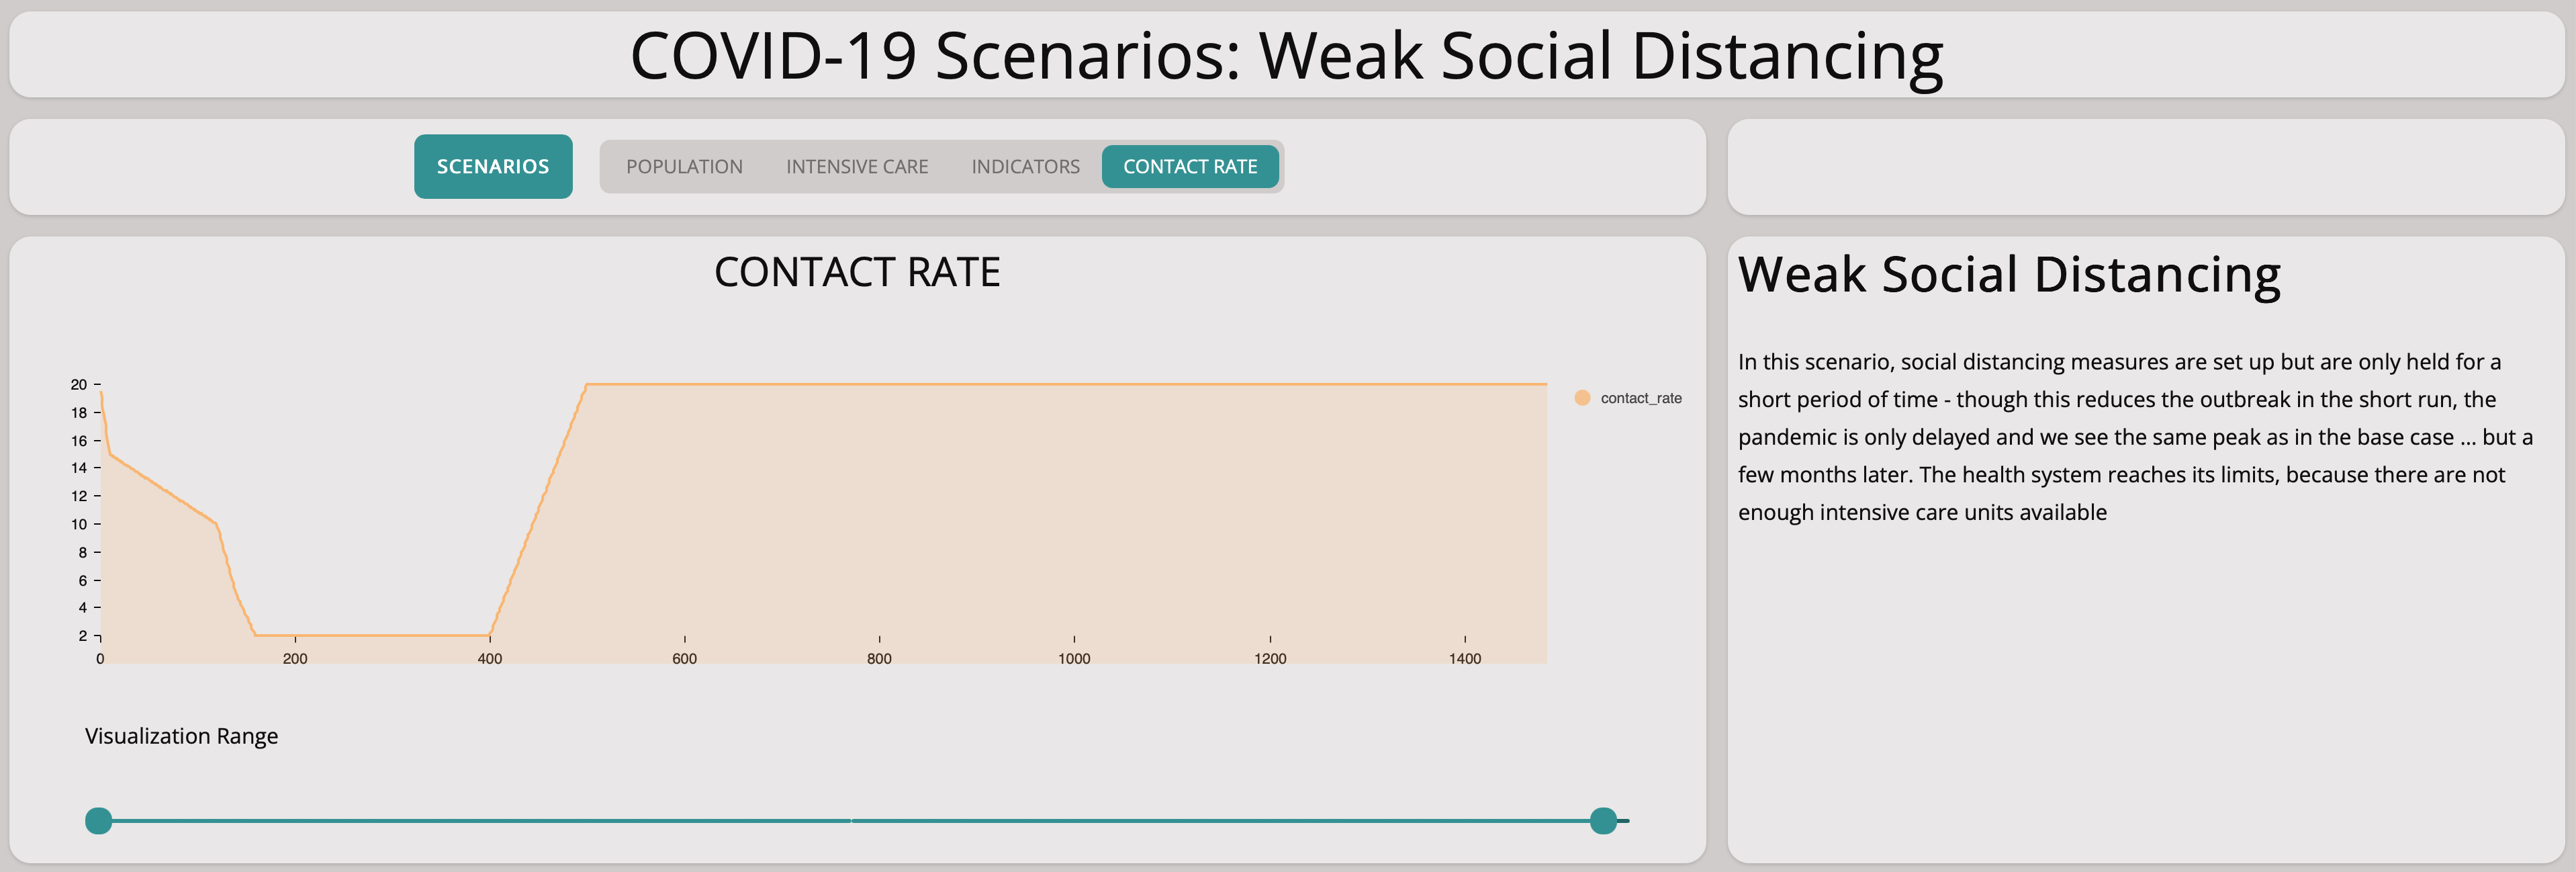
We immediately see that this does not help:
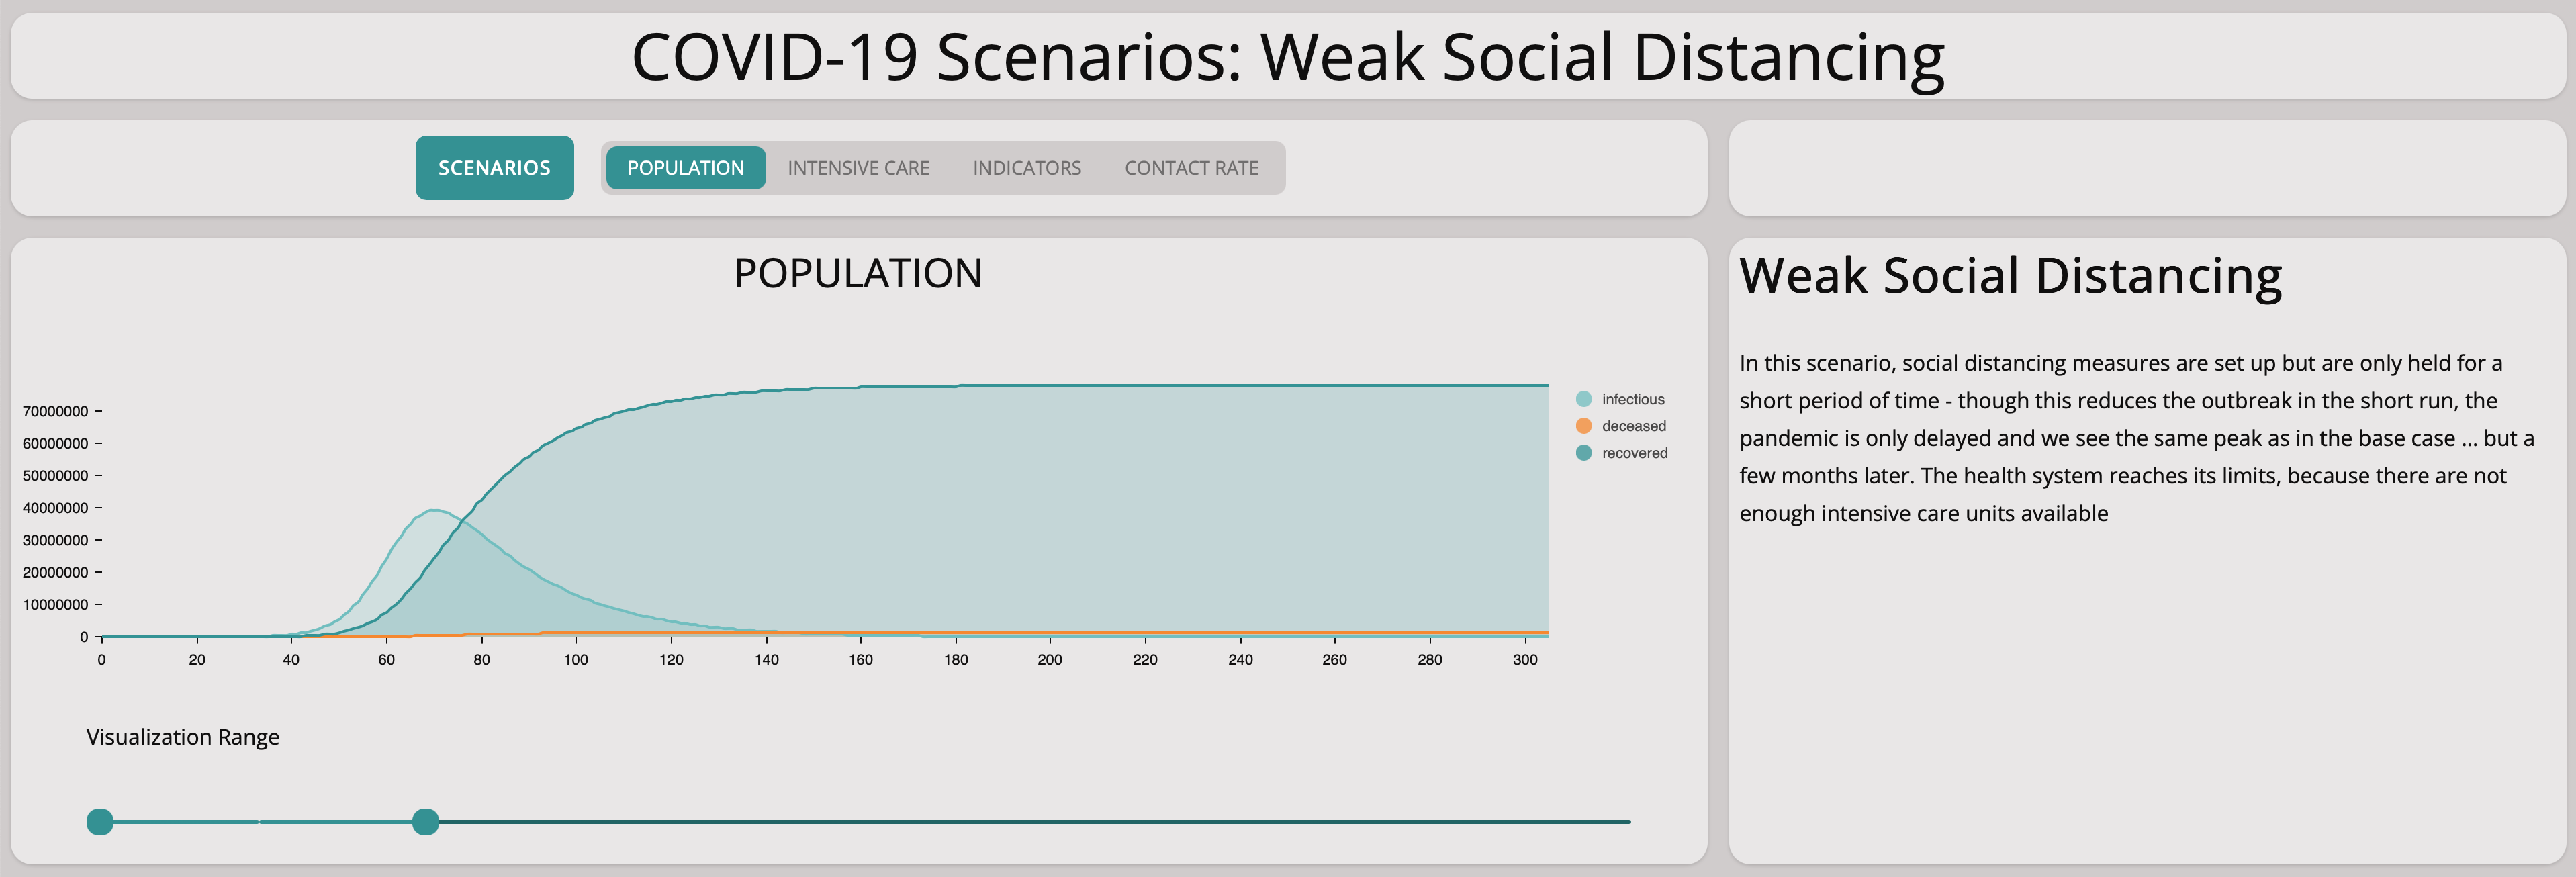
All that we achieve is to move the peak into the future. So this scenario would buy us time but not more. Of course, if we could find a vaccine by then – but clearly there are no guarantees for that.

Comparing this scenario with the base scenario shows that the problem is shifted to a later point in time. This means taking measures for only a short period of time will not stem the virus.
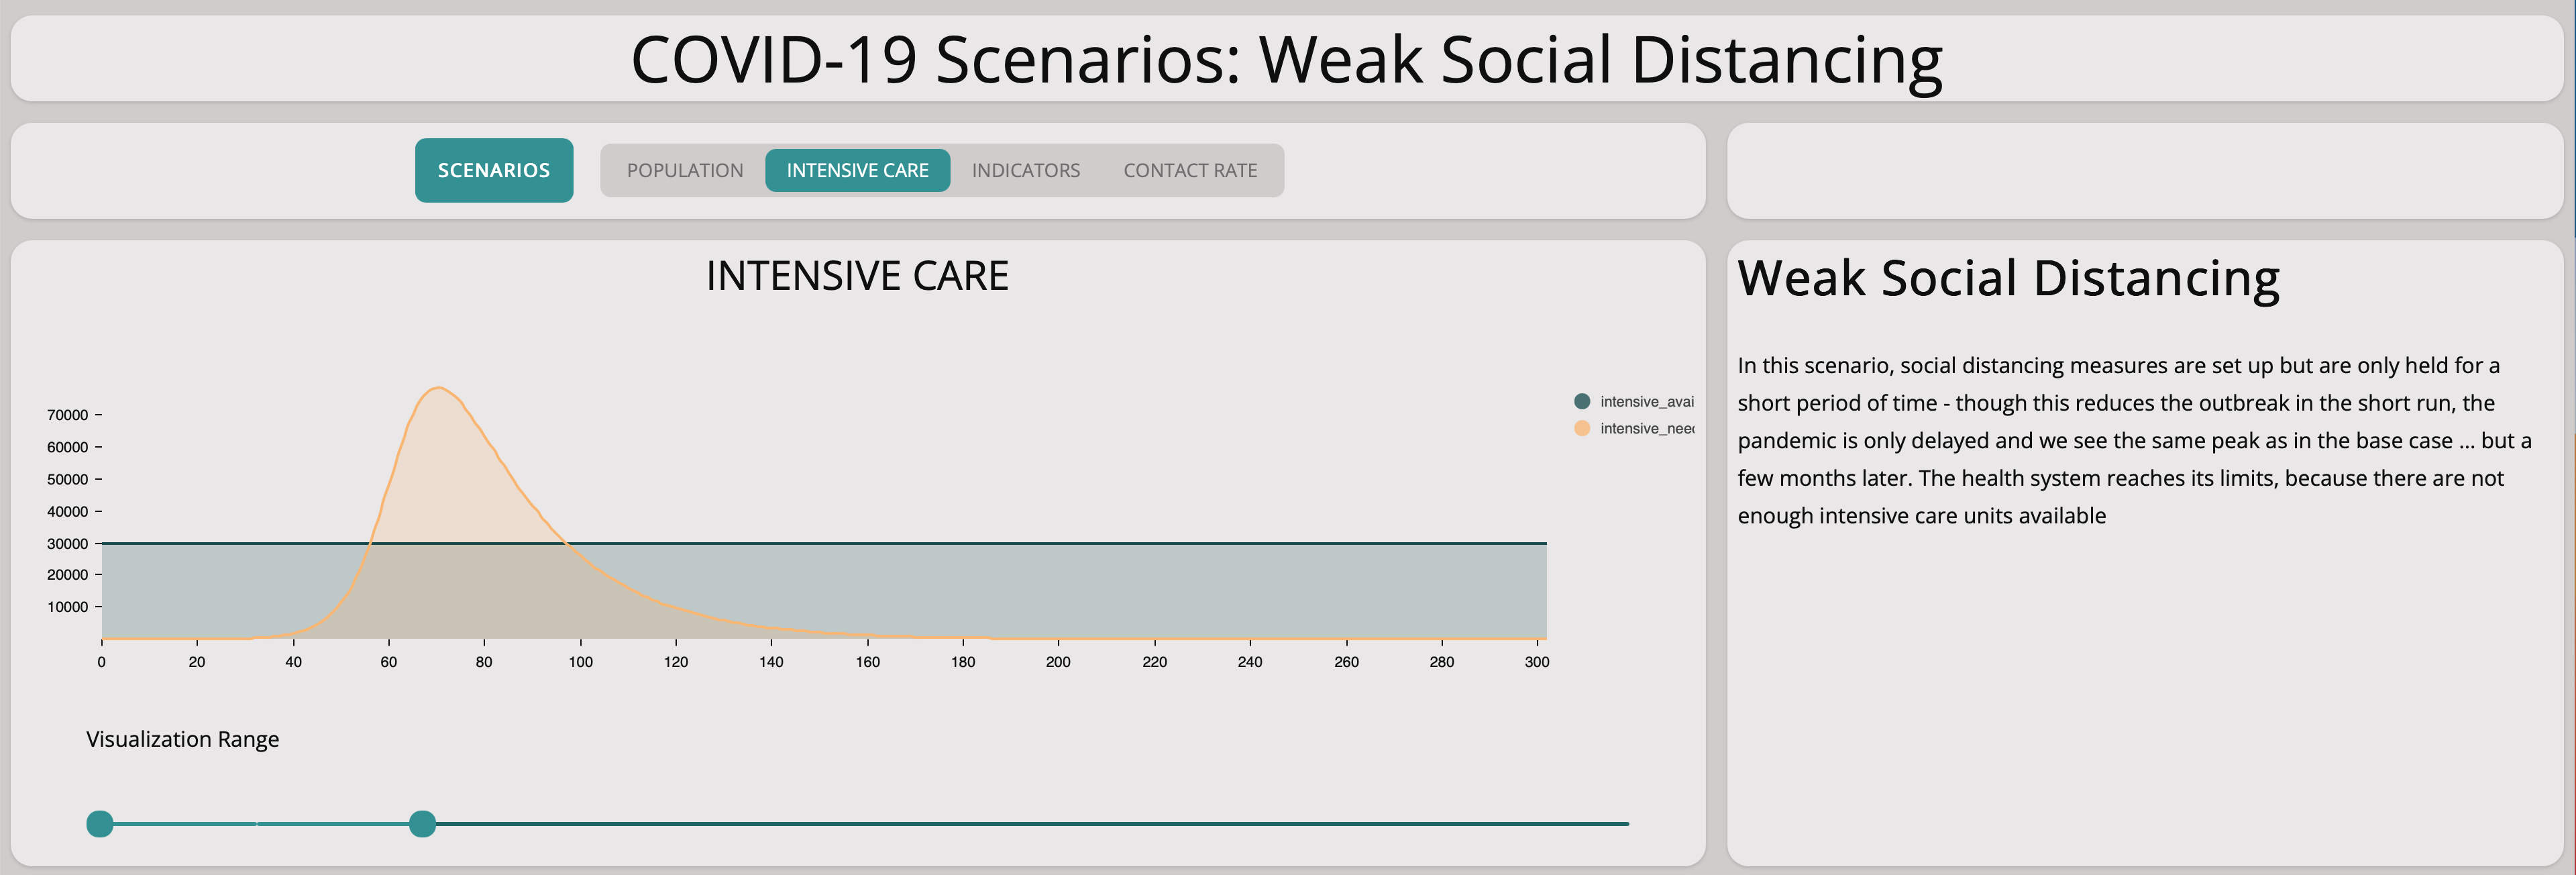
As expected, there are not enough intensive care units but only at a later point of time.
Summary
Though this is actually quite a simple model with only a few parameters, we can already simulate some interesting aspects of the COVID-19 pandemic:
- The behavior over the first 25 days fits nicely with the situation in Germany.
- If no measures are taken, we will experience exponential growth of COVID-19 cases in a very short period of time.
- Implementing strong social distancing methods leads to the desired result of keeping the number of COVID-19 cases low and not putting too much strain on the health care system.
- Unfortunately, the social distancing measures have to be kept up for quite some time in order to have an effect.
- Decreasing the infection rate down to zero does not help, because it just moves the problem into the future … we need to build immunity in the population.
The SIR model presented here could be extended in many ways:
- Currently, the model does not take into account regional differences.
- The recovery rate as defined in the SIR model does not seem to fit reality well … we should seek a more robust implementation.
- The model is only roughly calibrated – meanwhile we have plenty of data on the pandemic from all over the world, so there is an opportunity here for creating a more detailed, calibrated model.
Currently, we are working on an agent-based version of the model and are also planning to calibrate the model against available data. So make sure to check our Git Repository for future updates.
Services
Workshops
Resources
All Rights Reserved.


